


Last Week we gave Chopad Levels of 7455 , Nifty gave short entry on Monday and did all 3 targets by Wednesday thus rewarding discipline chopad followers by 175 points in matter of 3 trading sessions, Nifty was unable to close above the Chopad level of 7455 throughout the week. Nifty had the worst weekly fall in past 6 years and almost corrected 24 % from the high of 9119. Lets analyses how to trade nifty next week.
Nifty Hourly Chart

Hourly chart are trading in perfect channel as shown in above chart, so holding 6869 we can see bounceback till 7150/7250.
Nifty Harmonic

Nifty completed its black swan harmonic pattern so closing above 7043, can see move till 7151/7238.
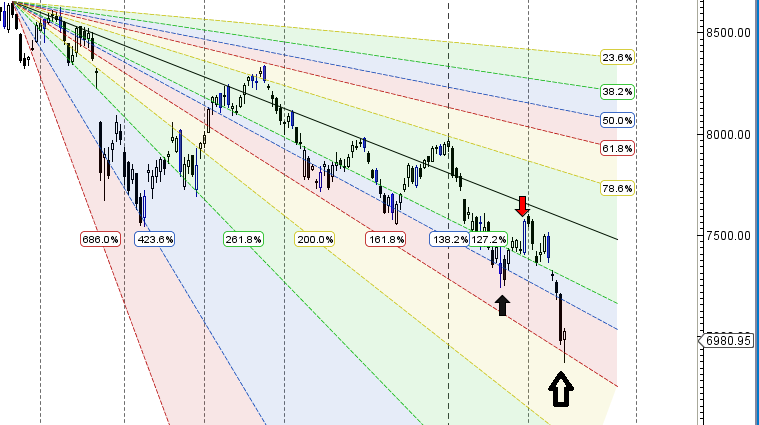
Nifty Gann Angles

As discussed in last week Gann angles are shown above as shown we can see move till blue line.
Nifty bounced exactly from gann angles. Holding 6869 we can see move till 7150/7250
Nifty Supply and Demand

As we have been discussing in past many week till we do not close above 7563 we can see move till 7120, Market never did a weekly close above and finally the big move came till 7120,below 7120 we boucned from 6869 which was near demand zone of 6860. Coming week move above 7070 can see move till 7120/7240.
Nifty Gann Date
Nifty As per time analysis 15/19 Feb is Gann Turn date , except a impulsive around this dates. Last week we gave 08/10 Feb Nifty saw a volatile move.
Nifty Gaps
For Nifty traders who follow gap trading there are 6 trade gaps in the range of 7000-9000, rest all gaps were filled in the last week fall.
- 8327-8372
- 7298-7271
- 8937-8891
- 8251-8241
- 8232-8209
- 8116-8130
Fibonacci technique
Fibonacci Retracement
Nifty moving in between the Fibo Arcs as shown above 6869/7143 are levels to be watched in coming week.
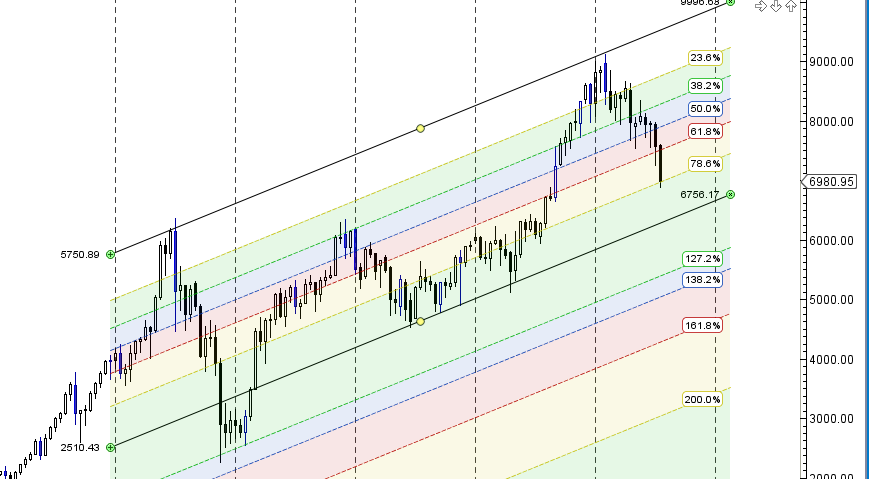
Nifty Weekly Chart

It was negative week, with the Nifty down by 508 points closing @6980 worst weekly fall in last 7 years as it moved below the middle trendline as shown in above chart and corrected till lower end and bounced from 200 W SMA, which have given good bounceback from past 3 occasion. Time Analysis also suggest we have corrected 49 week from the high of 9119, 49 is 7*7 and gann gave very important significance to number 7 so we might have formed short term bottom.
Trading Monthly charts
Monthly chart need to close above the of 78.6% @7150
Nifty PE

Nifty PE @18.67 valuation are coming to more realistic level
Nifty Weekly Chopad Levels
Nifty Trend Deciding Level:7035
Nifty Resistance :7116,7185,7263
Nifty Support :6980,6920,6856
Levels mentioned are Nifty Spot
Let me go by Disclaimer these are my personal views and trade taken on these observation should be traded with strict Sl.Please also read the detailed Disclaimer mentioned in the Right side of Blog.
Want to see post in your Inbox,Register by adding your email id in Post in your Inbox section
Follow on Facebook during Market Hours: https://www.facebook.com/pages/Brameshs-Tech/140117182685863
Follow on Twitter during Market Hours: https://twitter.com/brahmesh
LAST WEEK CHOPAD LVLS – BEST PERFORMER SO FAR ON SHORT SIDE
Bramesh sir , according to time cycle (7*7) gann theory we have made short term bottom. So can we expect a budget rally in coming 2 weeks . are we in bullish phase of Time cycle analysis?
thank you..
yes sir
Dear Brameshji, You have not mentioned gap of 7th Jan 2016. i.e. 7675-7721-41
thanks added now..
Bramesh sir please explain about option strategy gamma, beta value
sure will try to write an article
Support level 6920& 6856 ,please correct
plz post circle chart
Sir, please check support levels.typo miss