


There are three basic steps in spotting Harmonic Price Patterns:
- Step 1: Locate a potential Harmonic Price Pattern
- Step 2: Measure the potential Harmonic Price Pattern
- Step 3: Buy or sell on the completion of the Harmonic Price Pattern
By following these three basic steps, you can find high probability setups that will help you grab good profits.
Let’s see this process in action!
Step 1: Locate a potential Harmonic Price Pattern
I have shown Hourly chart of Shriram Transport Finance Company Limited and marked the potential harmonic pattern in forming
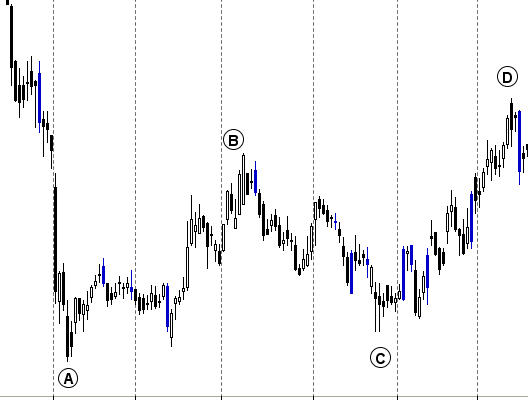
At this point in time, we’re not exactly sure what kind of pattern that is. It LOOKS like a three-drive, but it could be a Bat or a Crab…
Step 2: Measure the potential Harmonic Price Pattern
Using the Fibonacci tool, a pen, and a piece of paper, let us list down our observations.There are many Amibroker AFL and Software Available which can do the trick for you.

- Move AC is .786 retracement of move AB.
- Move CD is 1.272 extension of move BC.
- The length of AB is roughly equal to the length of CD.
This pattern qualifies for a Bearish ABCD pattern, which is a strong SELL signal.
Step 3: Buy or sell on the completion of the Harmonic Price Pattern

Once the pattern is complete, all you have to do is respond appropriately with a buy or sell order.
In this case, you should SELL at point D, which is the 1.272 Fibonacci extension of move CB, and put your stop loss a couple of points above your entry price and wait for target to come.
Is it really that easy?
Not exactly.
The problem with harmonic price patterns is that they are so perfect that they are so difficult to spot, kind of like a diamond in the rough.
More than knowing the steps, you need to have hawk-like eyes to spot potential harmonic price patterns and a lot of patience to avoid jumping the gun and entering before the pattern is completed.
How to calculate/determine target point of the pattern, after locating it on a chart. Thanks
I cover the smae in my trading course
sir motivewave detects harmonic pattern automatically…plz tell me how many bars should i take in consideration while plotting it..?…plz do reply sir as i m still a learning baby
min 250 bars
and to use 250 bars my chart should be in which time frame ?
its really gud article
can u please other pattern also which u mentioned genarally in stock patters like
demand and supply,Dravas ,gann arc,
couple of point means
Sir can you share cheat sheet for all harmonic patterns that will be helpfull.What we get in web not sure which one to follow.Also suggest which pattern is more profitable.
I FEEL — GO FOR SELL AT D AND PLACE ORDER ONLY AFTER THE HOURLY BEARISH CANDLE IS COMPLETE AFTER POINT D.
Dear Bramesh,
Which software do you use to draw this pattern?
Is these number 0.786 and 1.272 shall be exact while drawing or only approximated?
Any software can be used to draw Fibo numbers. It should be exact.
Dear Bramesh,
I used http://www.tradingview.com to draw the same ABCD Harmonic pattern which was based on EOD BSE data.
I got only numbers AC=0.859 (instead of 0.786) and BD=1.31 (instead of 1.272).
Please guide me what is wrong here? the charting tool or data?
I am plotting on cash market and ratios are matching
Could you please give me values of ABCD used to calculate the ratios?
Thanks,
nava
THANKS NAVA JI for sharing weblink info. it is a good US website
sir my doubt is also same as prasant asked?
in which time scale the pattern should be identified ??.i have seen the patterns in 5min ,15 min,30 min,hrly .day.which one is more realistic ??
Any time frame can be used. Harmonic gives you target and SL you need to stick with it.
Rgds,
Bramesh
sir why you asked us to buy at D , i thought its SELL since its bearish harmonic.. may be i didnt get your point or understand properly.
very good sir
“In this case, you should buy at point D, which is the 1.272 Fibonacci extension of move CB,”
But point D has already gone.
“and put your stop loss a couple of points above your entry price and wait for target to come.””
sould not the stop loss below for a buy
It is Sell
Everytime likes your articles. Pl guide about r com