


Last week we gave Chopad Levels of 7850 , Nifty opened below Chopad levels, made high of 7825 and short Intitated during first were rewarded with all three target done by Friday. Nifty made low of 7575 which was near 52 week low of 7539.Lets analyze how to trade market in coming week which will be volatile as FED Rate Hike will keep market on the edge.
Nifty Hourly Chart

Nifty trading in pyrapoint angles in range of 270/315, break of any one of them will be see another move of 125 points so break of 7575 can lead to fall near 7400, holding 7575 can see move back to 7700
Nifty Harmonic
 SHARK Pattern will be formed if we go near 7550/7530 and close above it, Below that the pattern will FAIL/INVALIDATED.

ABCD Pattern which will complete PRZ is in range of 7237/7250, Pattern formation will gets activated once NIfty breaks and close below 7539.
Nifty Gann Angles

Failed to Hold the Blue gann angle line can see fast and furious move towards 7400, bullish above 7700 only.
Nifty Supply and Demand

Self explanatory chart of Weekly Supply and Demand zone is shown,Weekly close below 7560 can have serious implication with Nifty falling as low as 7118.
Nifty Gann Date
Nifty As per time analysis 17 Dec is Gann Turn date , except a impulsive around this dates. Last week we gave 07/11 Dec Nifty saw a volatile move.
For Nifty traders who follow gap trading there are 15 trade gaps in the range of 7000-9000
- 7067-7014
- 7130-7121
- 7276-7293
- 7229-7239
- 7454-7459
- 7931-7912
- 7864-7821
- 7950-8005
- 8327-8372
- 8937-8891
- 8251-8241
- 8232-8209
- 8116-8130
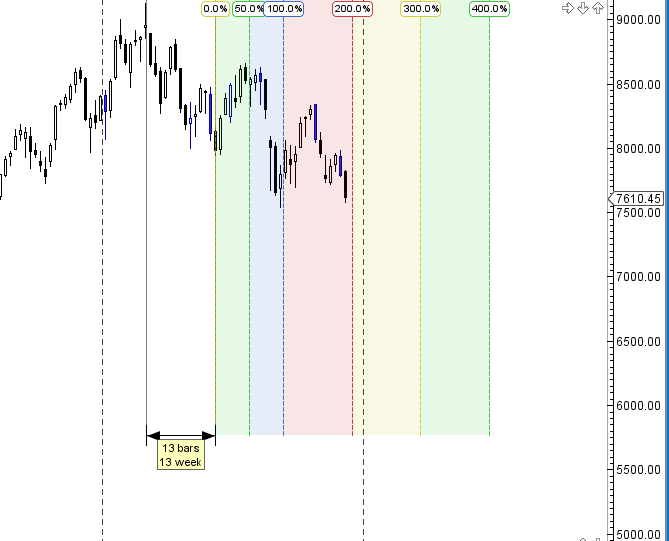
Fibonacci technique
Fibonacci Retracement

7539/7323 are levels to be watched in coming week.
Nifty Weekly Chart
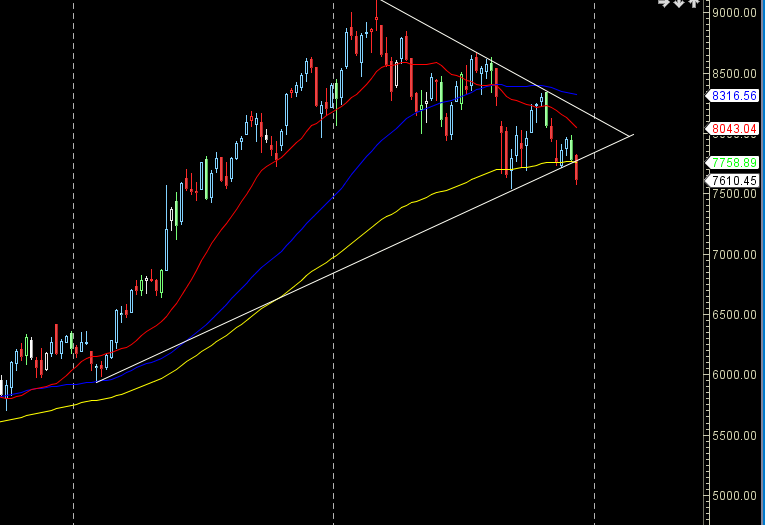
It was negative week, with the Nifty down by 171 points closing @7610,breaking trendline and closing below its 20 WEMA and 55 WEMA and 100 WEMA .100 WEMA has supported last 6 time now now has failed suggesting beraish view till we do not go over it. Another 1 week of pain can be seen as per time analysis.
Trading Monthly charts

Monthly chart took resistance @50% and suppot near 61.8% retracement line.
Nifty PE

Nifty PE @20.58 , Nifty is bouncing from 20.5-21 PE as seen in past instance.
Nifty Weekly Chopad Levels
Nifty Trend Deciding Level:7555
Nifty Support:7506,7430,7376
Nifty Resistance:7636,7685,7766
Levels mentioned are Nifty Spot
Let me go by Disclaimer these are my personal views and trade taken on these observation should be traded with strict Sl.Please also read the detailed Disclaimer mentioned in the Right side of Blog.
Want to see post in your Inbox,Register by adding your email id in Post in your Inbox section
Follow on Facebook during Market Hours: https://www.facebook.com/pages/Brameshs-Tech/140117182685863
Follow on Twitter during Market Hours: https://twitter.com/brahmesh
Dear sir i want to know that gann boxes change ad per the market movment or market volatality
Sir..unable to understand nifty PE. Can you explain ?
Price to Earning Ratio
Sir, Nifty support and resistance levels are reversed. Please correct and thanks for all the analysis.
Dear Sir, support and resistance seems to be interchanged, pls check
Thanks its Updated