


Last week we gave Chopad Levels of 7896 , Nifty was volatile last week trading above and below the Chopad levels, Shorts Intitated during first half of week did 1 Target, Longs were rewarded with first target on Friday. Lets analyze how to trade market in coming week where we have RBI policy,GDP Data and Monthly closing.
Nifty Hourly Chart
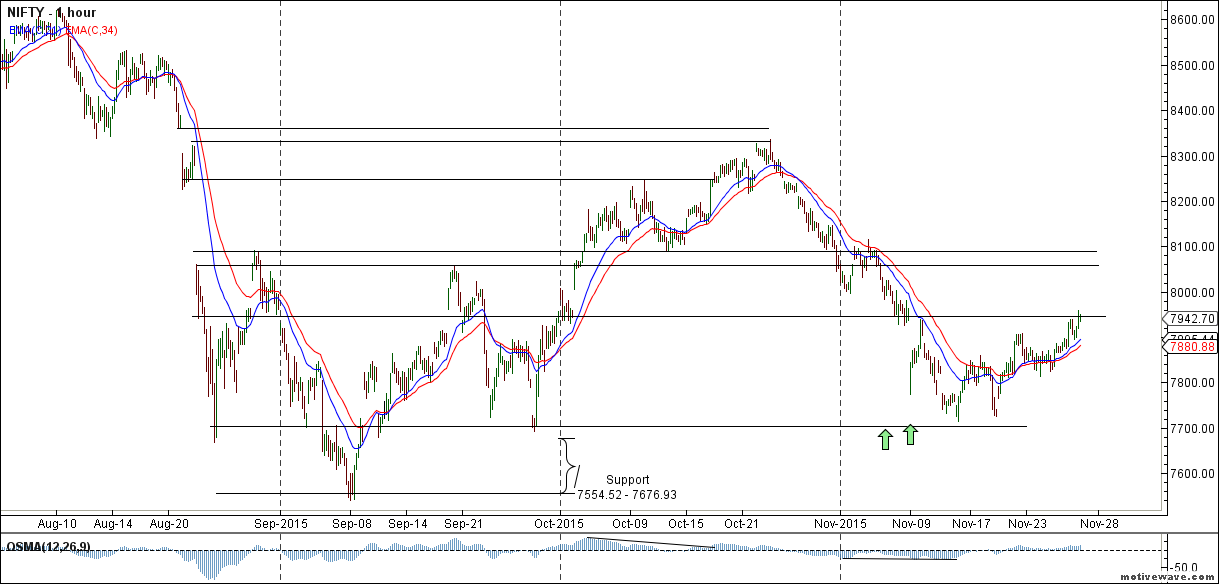
Trading in range of 7937-7800, close above 7950 can see in moving towards the supply zone of 8056/8116 in coming week, Support at 7825/7752.
Nifty Harmonic
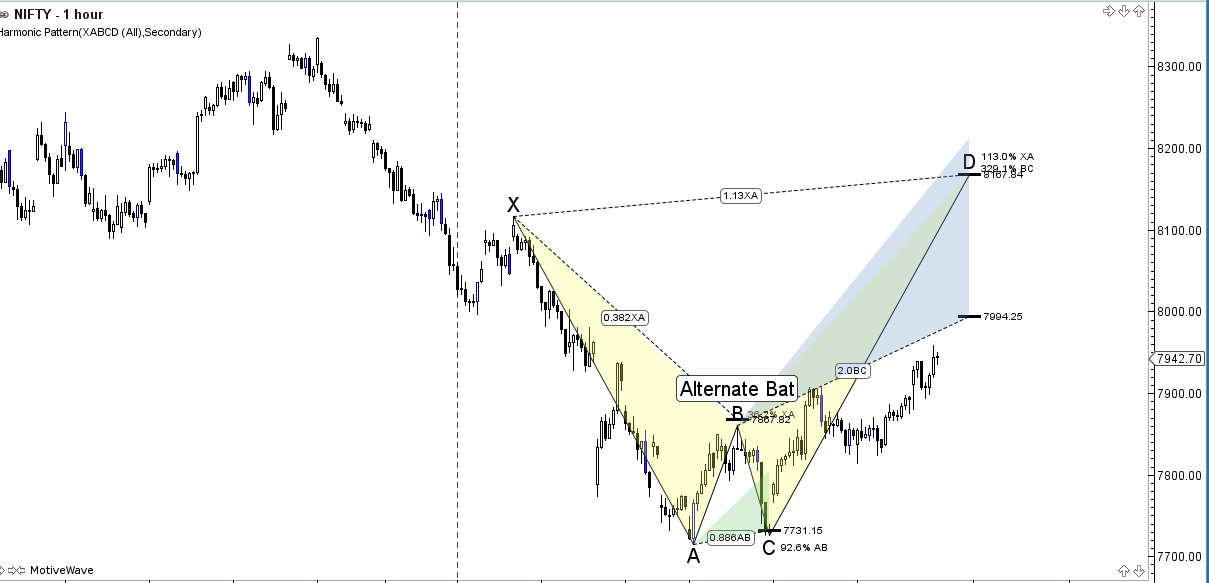
Alternate Bat pattern which is valid till 7731 is not broken for upside target of 7994 and 8167.
Nifty Gann Angles
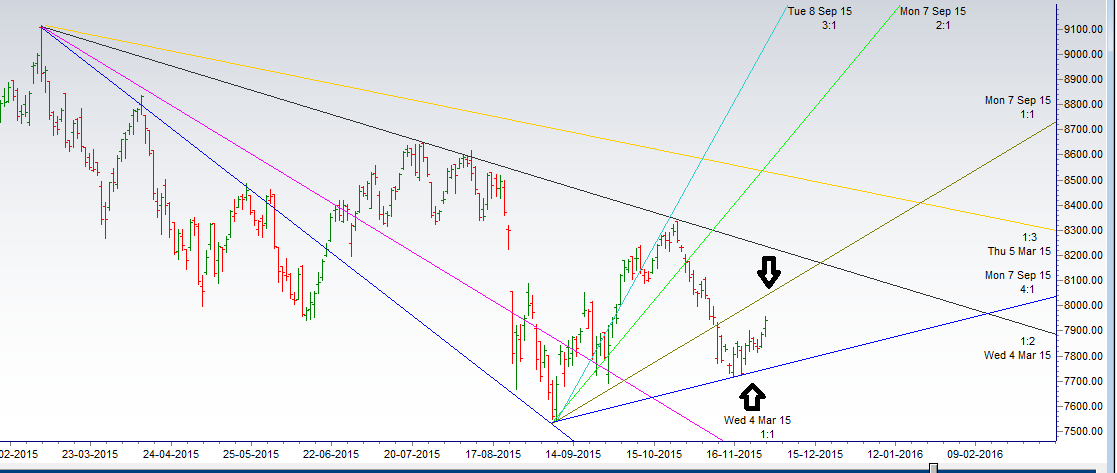
As discussed last week Coming week till the blue line holds rally possible till 7937/7997.
High made 7959 and close above 7937, Resistance around 7995/8058 as per gann angle.
Nifty Supply and Demand

Self explanatory chart of Supply and Demand zone.
Nifty Gann Date
Nifty As per time analysis 02 Dec is Gann Turn date , except a impulsive around this dates. Last week we gave 24/27 Nov Nifty saw a volatile move.
For Nifty traders who follow gap trading there are 15 trade gaps in the range of 7000-9000
- 7067-7014
- 7130-7121
- 7276-7293
- 7229-7239
- 7454-7459
- 7775-7825
- 7950-8005
- 8327-8372
- 8937-8891
- 8251-8241
- 8232-8209
- 8116-8130
Fibonacci technique
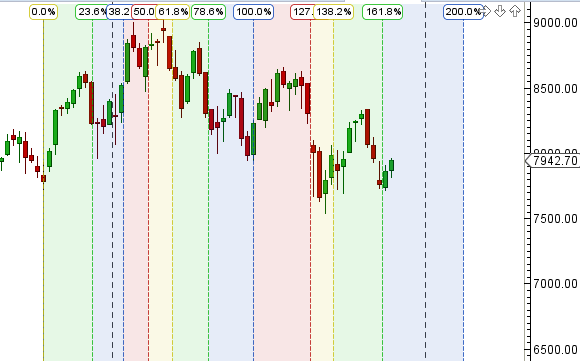
Fibonacci Retracement

7802/7847/7912/7965/8034 are levels to be watched in coming week.
Nifty Weekly Chart
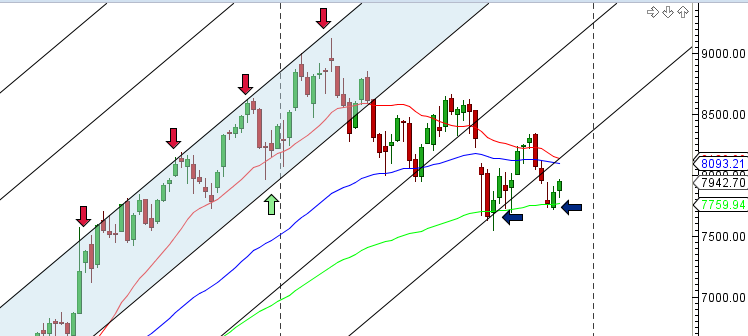
It was positive week, with the Nifty up by 86 points closing @7943closing below its 20 WEMA and 55 WEMA and again took support at 100 WEMA .100 WEMA has supported last 5 time now. Nifty continues to trade in its weekly channel,As discussed last week With the off set of new time cycle market seems to have formed short term top further confirmation in coming week. We can see quick move towards 20/55 WEMA if 7994 is broken on weekly basis.
Trading Monthly charts
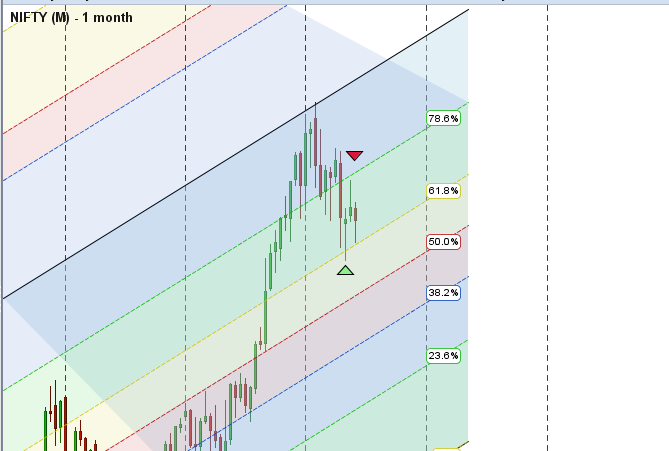
Monthly chart took support @61.8% retracement line and showed bounce back and unable to cross 78.6% retracement.
Nifty PE
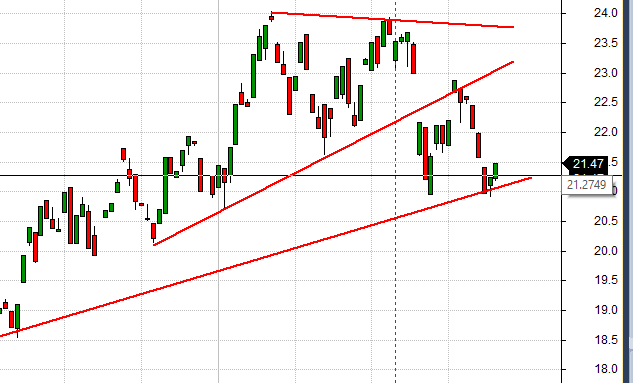
Nifty PE @21.47 , valuation are quiet expensive looking at result season we have just gone through.
Nifty Weekly Chopad Levels
Nifty Trend Deciding Level:7950
Nifty Resistance:7995,8069,8116
Nifty Support:7906,7855,7760
Levels mentioned are Nifty Spot
Let me go by Disclaimer these are my personal views and trade taken on these observation should be traded with strict Sl.Please also read the detailed Disclaimer mentioned in the Right side of Blog.
Want to see post in your Inbox,Register by adding your email id in Post in your Inbox section
Follow on Facebook during Market Hours: https://www.facebook.com/pages/Brameshs-Tech/140117182685863
Follow on Twitter during Market Hours: https://twitter.com/brahmesh
CLEAR CUT ANALYSIS
THANKS
Apart from HNS also bearish flag 🙁
Sirji, its making HNS pattern too…Please look in to it
thank you sir for the analysis