


Last week we gave Chopad Levels of 7880 , RBI surprised the market with 50 BPS rate cut,long taken as per Chopad levels got rewarded with 238 points as Nifty did all 1 targets on Upside, missed 2 target by 12 points and 2 targets on downside were done. Lets analyze how to trade market in coming week as we have no trading holiday after 3 weeks 🙂
Nifty Hourly Chart

Nifty Hourly charts are shown above which have been trading in a range bound volatile mode from last 1 month, once this consolidation is over we will see breakout above 8075 or breakdown below 7767 on closing basis for 250/300 points rally, so plan trade accordingly.
Nifty Pyrapoint

This is what we discussed last week 180 degree @7920 if resisted again nifty heading towards 7787/7623 odd levels.Closing above it heading towards 8000/8080.
For coming week 135 @7955/7975 range will act as resistance and support @180.
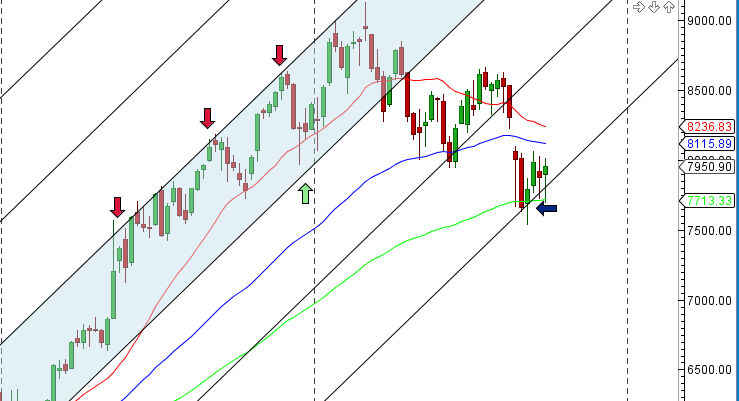
Nifty Supply and Demand with Gann Swing Point

This is what we discussed last week 7767 should be closely watched on downside and 7958 on upside.Nifty was unable to close below 7767 and gave 200 point rally and from past 2 session unable to close above 7958 so both side trade can be done.
For coming week again 7958 is point of focus closing above it can see 8075/8113/8182 and unable to do that other move towards 7767.
Gann Swing points are market with red and green arrows in above chart.
Nifty Harmonic Analysis
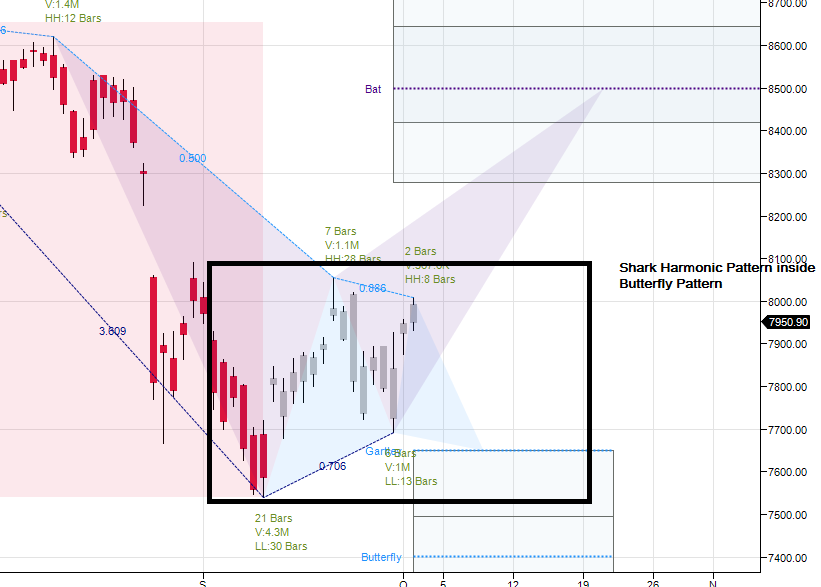
Nifty is also forming a shark pattern so unable to close above 8012/8055 can see again a move till 7800/7650.
Nifty Gann Box

Nifty Gann Date
Nifty As per time analysis 05 Oct/09 Oct is Gann Turn date , except a impulsive around this dates. Last week we gave 30 Sep Nifty saw a volatile move .
Nifty Gaps
For Nifty traders who follow gap trading there are 15 trade gaps in the range of 7000-9000
- 7067-7014
- 7130-7121
- 7276-7293
- 7229-7239
- 7454-7459
- 7526-7532
- 7598-7568
- 7625-7654
- 7780-7856
- 7927-7940
- 8174-8195
- 8091-8102
- 8322-8372
- 8355-8381
- 8937-8891
Fibonacci technique
Fibonacci Retracement

8097/7965 /7912/7802 should be watched in coming week.

Touched the high of Fibo Fan and retraced back.
Nifty Weekly Chart
It was positive week, with the Nifty up by 82 points closing @7950, and closing below its 55 WEMA and 20 WEMA and bouncing from 100 WEMA and held its trendline support as shown in above chart. Time Cycle started on negative note.

Trading Monthly charts

Monthly chart took support @61.8% retracement line and showed bounce back.
Nifty PE
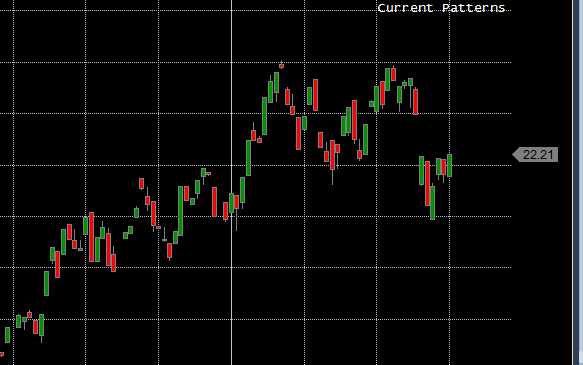
Nifty PE @22.21 , still not corrected on a big note.
Nifty Weekly Chopad Levels
Nifty Trend Deciding Level:8000
Nifty Resistance:8075,8113,8188
Nifty Support:7958,7880,7800
Levels mentioned are Nifty Spot
Let me go by Disclaimer these are my personal views and trade taken on these observation should be traded with strict Sl.Please also read the detailed Disclaimer mentioned in the Right side of Blog.
Want to see post in your Inbox,Register by adding your email id in Post in your Inbox section
Follow on Facebook during Market Hours: https://www.facebook.com/pages/Brameshs-Tech/140117182685863
Sir 8188 as u said was right but can u please enlighten on 8188 was correctly taken as resistance
It based on my supply and demand analysis
Can u pls give extra light on the analysis
Regards
Sir,
Currently Nifty has ended at 7951 which is nearly 50 points away from Chopad level. Based on this should we take shorts if it moves closer to 8000 with a 15 min. close above 8000 to cover and go long? Does this approach make sense. Or simply a move above 8000 is enough to go long say with a 20 point SL.
Regards,
Raman
move above 8000 is required
Sir gann date 10 October is Saturday. or 5 and 8 October
Nifty will try to push upwards during first half of next week.Major Resistence lies between 8173-8220 spot zone.Next week is important for both bulls and bears.watch out for 8200 Put as low risk entry can be taken as markets will try to confuse market participants with fast move either sides.
Sir please check 10 October Saturday is correct?
Its corrected..
Nifty As per time analysis 05 Oct/09 Oct is Gann Turn date