


Last week we gave Chopad Levels of 8546 , Nifty did 3 target on downside rewarding chopad followers. Lets analyze how to trade market in coming week.
Nifty Hourly EW Chart

Nifty hourly chart as per EW analysis should compelte abc correction in range of 8173/8195 and next price action to be seen around these levels.
Nifty Gunner

Nifty gunner shows support in range of 8105-8095 around the green arc. Resistance above the gann 1*2 line/
Nifty Gann Box

Gann Box on daily chart is shown above suggesting resistance in range of 8356 levels.Strong support at 2×1 line at 8156/8140 levels,
Nifty Supply and Demand

8124 is where demand zone starts.
Nifty Harmonic Analysis

Nifty as per Harmonic Analysis the current bottom once formed and if 7940 is held can lead to big rally in September month.
Nifty Gann Date
Nifty As per time analysis 24August/27 August is Gann Turn date , except a impulsive around this dates. Last week we gave 19 August/21August Nifty saw a volatile move .
Nifty Gaps
For Nifty traders who follow gap trading there are 15 trade gaps in the range of 7000-9000
- 7067-7014
- 7130-7121
- 7276-7293
- 7229-7239
- 7454-7459
- 7526-7532
- 7598-7568
- 7625-7654
- 7780-7856
- 7927-7940
- 8174-8195
- 8091-8102
- 8322-8372
- 8355-8381
- 8937-8891
Fibonacci technique
Fibonacci fan

38.2% again will act as resistance and support at 23.6% as resistance as shown above.
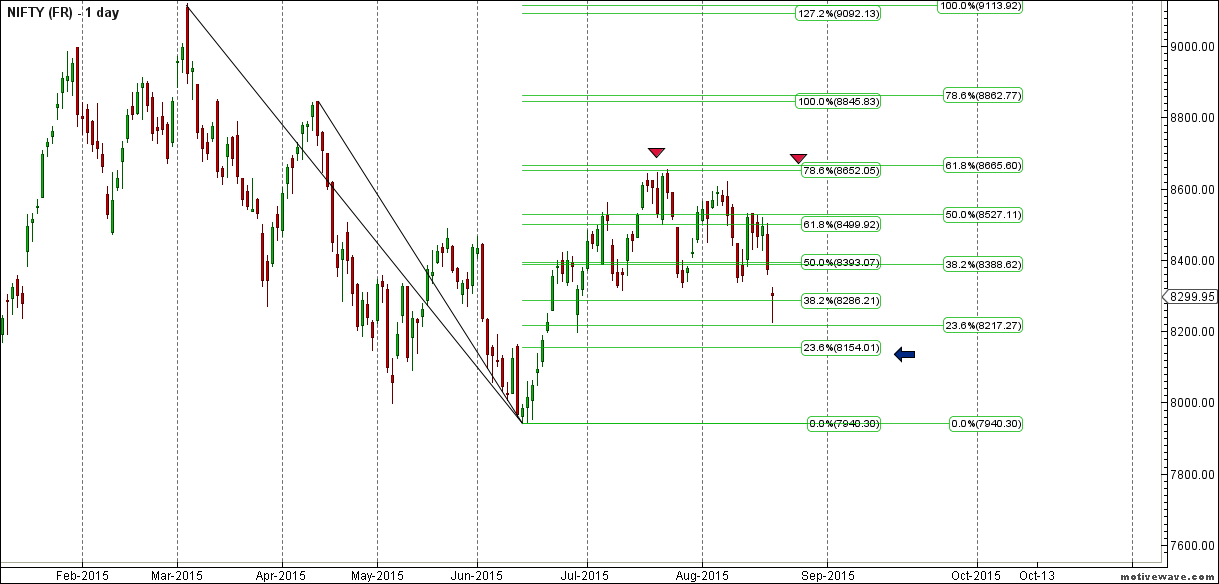
8154/8093 is fibo retracement as shown above are important level to be watched in coming week
Nifty Weekly Chart
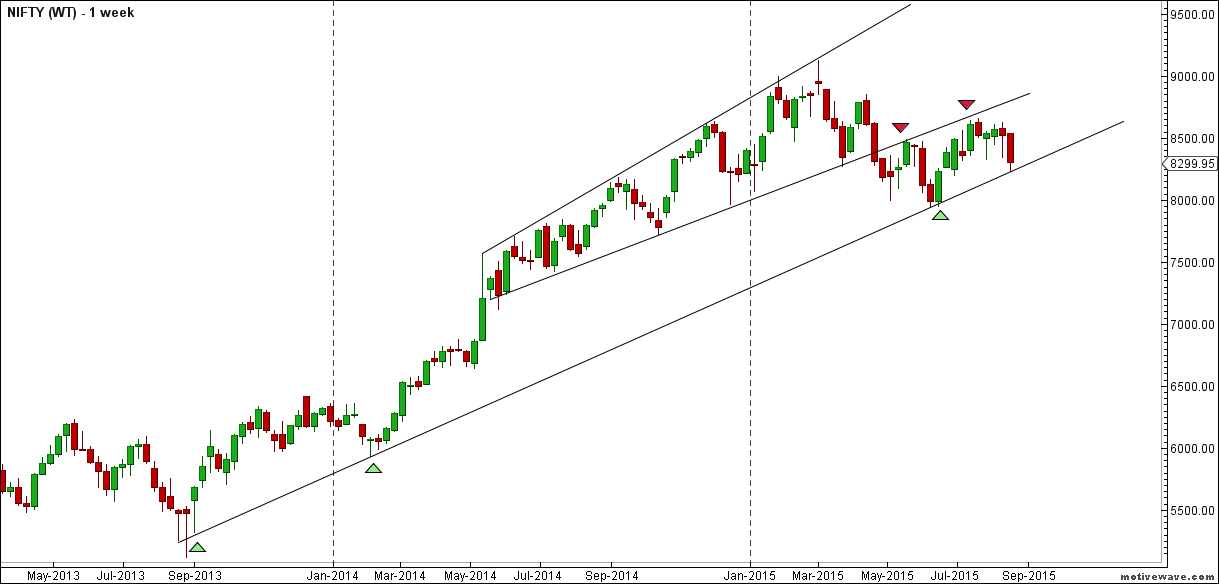
It was negative week, with the Nifty down by 218 points closing @8299 forming hammer candlestick pattern , and closing above its 55 WEMA and below its 20 WEMA and held its trendline support as shown in above chart. We are still in Bullish time cycle from 14 June till mid September, correction in between should be bought into with proper risk management.

Trading Monthly charts

Monthly chart after 2 Month of hammer candlestick,saw a bullish candlestick, and again nifty took support @78.6 % if low held we should see nifty moving above 8650 in medium term.
Nifty PE

Nifty PE @22.99 , so atlast seeing some correction in valuation
Nifty Weekly Chopad Levels
Nifty Trend Deciding Level:8173
Nifty Resistance:8226,8286,8350
Nifty Support:8107,8026,7940
Levels mentioned are Nifty Spot
Let me go by Disclaimer these are my personal views and trade taken on these observation should be traded with strict Sl.Please also read the detailed Disclaimer mentioned in the Right side of Blog.
Want to see post in your Inbox,Register by adding your email id in Post in your Inbox section
Follow on Facebook during Market Hours: https://www.facebook.com/pages/Brameshs-Tech/140117182685863
Dear bramesh,
Congrats again for your best efforts to educate traders with excellent levels.as per your pists nifty broken all support.as per earlier posts enter in quality stocks at 7940-8000 levels,this is the right time,weekly all support broken in nifty as per weekly levels.kindly update next support zones for buy.
Please check the Supply and Demand chart levels are mentioned.
Dear Bramesh
Thank you very much. Your effort is really helpful for so many of us. God Bless .
Saurabh well said,Bramesh you r great & Thanks for your valuable technical support & advice.
Market is great we are just followers.
nifty spot before expiry level—8150 to 8095 one more point –at spot 8128 a rebound level is there in weekly CHART
26585 sensex clear cut danger signal for expiry
bnf gap down point may be 17730 on monday
Thank you sir
what we keep forgetting & repeating is to predict the market, Just need to react to it rather than predict where it will go ! 🙂
Dear Sachin,
This is not Moneycontrol board where any Tom, Dick or Harry come and blurt some numbers. This is Bramesh’s own blog where people come who see value in his analysis or try to learn something. If you don’t agree with his analysis, you should not waste your time here. Go write your own blog or use your energies in something creative.
Your comments are in bad taste and show that you are trying to use his tremendous popularity to get a platform for your own gratification and publicity. Grow up dude. People like you don’t reach anywhere.
Thanks Sukhdeep and Saurabh for appreciating the work.
U R RIGHT SUKHDEEPJI
MY ADVISE TO COMMENTORS -DON T THROW BRICKBAT IF U CAN T BRING BOUQUET
WE R DIE HARD ADMIRERS OF BRAMESHJI WHO DOES GREAT ANALYSIS HELPFUL TO ALL
sir nifty close is 8299 and t.c. level is 8173. almost 125 points less. is it correct level?
IN MY VIEW 8150 MAXIMUM IN THIS SERIES….
NIFTY (AUGUST)
we are becoming too bearish from the comments. And when sentiment is at the extreme, consensus usually fails. we may test 7950 again but we are not going into a bear market. Fundamentals and technical are not supporting a consistent level below 8000 for the India Equity markets. When financial markets are at their worst, politicians are forced to apply remedial measures which pump up the markets leading to huge rallies on the markets. it was a good trade to short at 8580 for targets of 8150 which is lost likely going to be achieved. now sit back and relax till September expiry. time to spend money made rather than take event risk…..
Sir whats the tc level for monday both positional, intraday. If u are about to write daily analysis no need to give.
Nifty broke neckline of Head and shoulder formed on daily bar for tgt 8035.Also 61.8% level for entire move from 7940 to 8655 comes at 8213.If nifty remain below 8213 it can come close to retest previous lows.Also bank nifty Head and shoulder pattern tgt coms at 17200.Tgt should get completed max. by October month.
Hi Bramesh
Would be very helpful if you can put a note or link on how to trade Nifty using the weekly chopad levels as you have done for intraday and positional for stocks. If its there some where kindly provide the link. regards
Sir, When is the next gann emblem date. Is it in September?
Thanks
Sep 02 Gann Emblem date
Dear Sachin,
Chopad was 8546 NS made High of 8530 For me level works.
Rgds,
Bramesh
Dear Gaurav,
Traders do not dream they trade based on the market conditions and signal generated based on the system. For Instance 8546 of Chopad level NS made high of 8530 so it never went of Chopad level and achieved target as expected.If you are not getting any benefit out of analysis please concentrate your energy in something which is benefiting you.
RGds,
Bramesh
Hello Mr Sachin,
How many lots you have bought in Puts or shorted nifty future. If you are making money consistently then you are using some form of studies, possibly of Mr bramesh analysis. Be thankful in language and should earn money not crap. A silent learner and person with humility goes many miles in success, Be a person of this stature.
Your friend
Hi bramesh,
As per the above chart 7940 seems to be big support…Any chance it can come down to 7500 ?..
Thanks for the thorough analysis. We are in big trouble now. Friday the US market volatility index (Vix) closed over 28. Our India Vix is only 17 and usually trades at 1.25 to 1.5 times the US Vix. So a big catch up to the downside is coming. 8000 can be taken out in no time.
Very well said