


Divis Lab
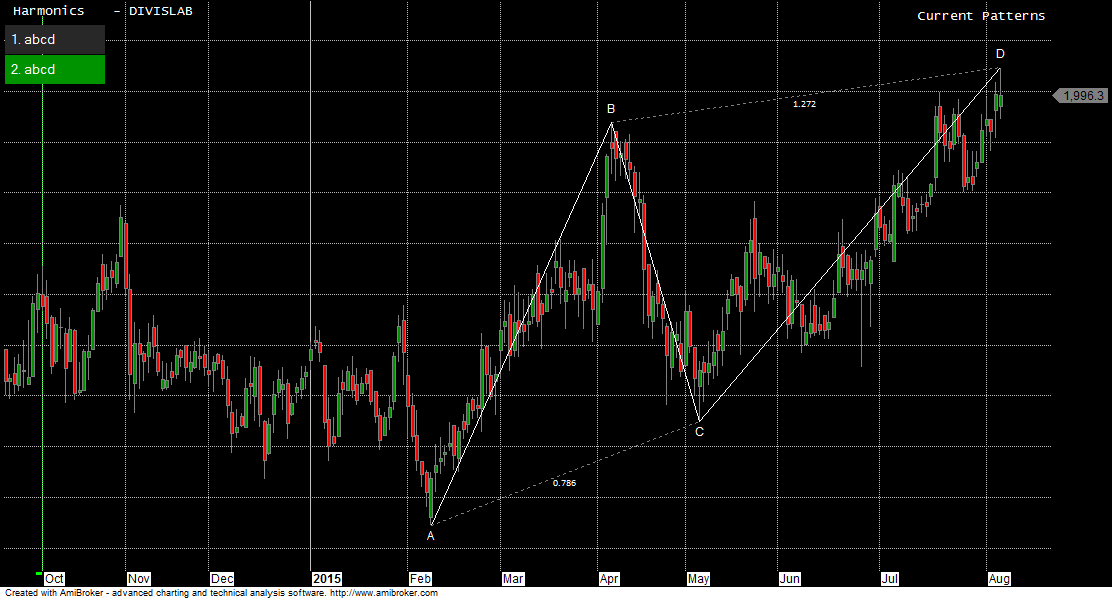
Positional/Swing Traders can use the below mentioned levels
Close below 1974 target 1930/1900
Intraday Traders can use the below mentioned levels
Buy above 2000 Tgt 2020,2045 and 2070 SL 1990
Sell below 1985 Tgt 1972,1950 and 1920 SL 1998
DHFL
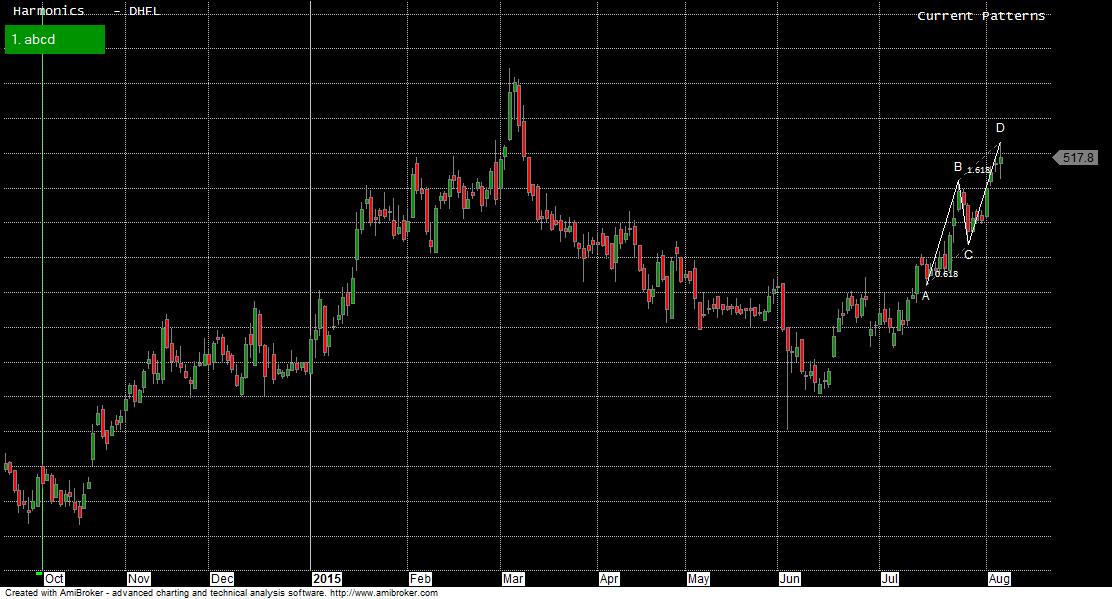
Positional/Swing Traders can use the below mentioned levels
Unable to close above 521 target 500/480
Intraday Traders can use the below mentioned levels
Buy above 518 Tgt 522,527 and 538 SL 515
Sell below 513 Tgt 510,507 and 500 SL 515
IDFC
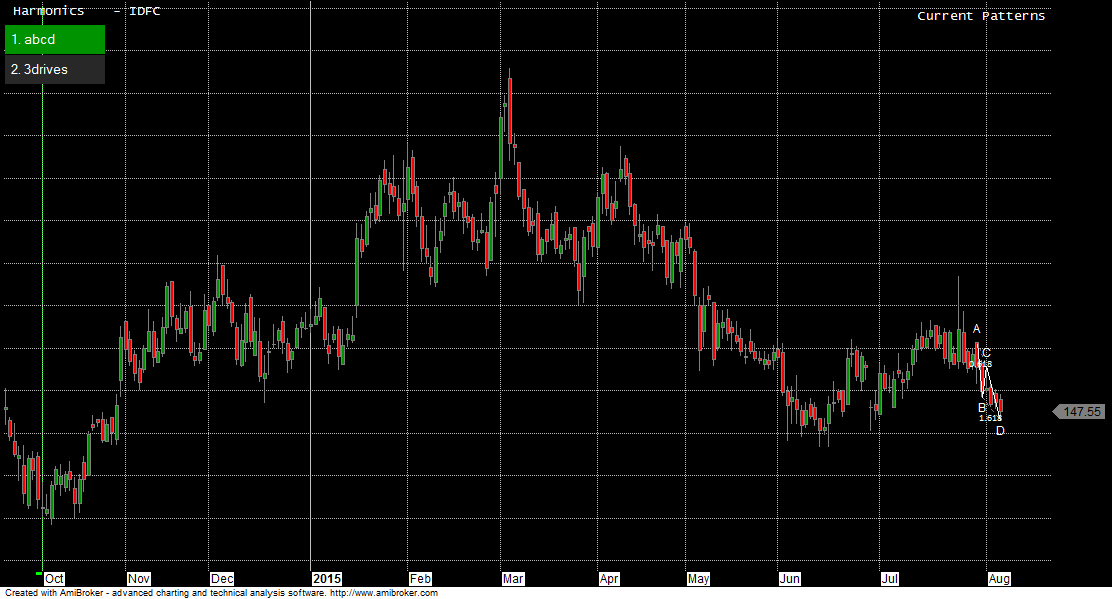
Positional/Swing Traders can use the below mentioned levels
Unable to close above 147 target 144/141
Intraday Traders can use the below mentioned levels
Buy above 148 Tgt 149.1,151 and 153 SL 147
Sell below 146 Tgt 144.5,143 and 141 SL 147.5
How to trade Intraday and Positional Stocks Analysis — Click on this link
Performance sheet for Intraday and Positional is updated for July Month, Intraday Profit of 2.30 Lakh and Positional Profit of 3.35 Lakh
http://tradingsystemperformance.blogspot.in/
http://stockpositionaltrading.blogspot.in/
- All prices relate to the NSE Spot/Cash Market
- Calls are based on the previous trading day’s price activity.
- Intraday call is valid for the next trading session only unless otherwise mentioned.
- Stop-loss levels are given so that there is a level below/above, which the market will tell us that the call has gone wrong. Stop-loss is an essential risk control mechanism; it should always be there.
- Book, at least, part profits when the prices reach their targets; if you continue to hold on to positions then use trailing stops to lock in your profits.
Follow on Facebook during Market Hours: https://www.facebook.com/pages/Brameshs-Tech/140117182685863
Please also read the detailed Disclaimer mentioned in the Right side of Blog.
Dear Mr Ramesh,
For 07-Aug Intra-day DHFL, you have given
Buy above 518 Tgt 522,527 and 538 SL 515
Sell below 513 Tgt 510,507 and 500 SL 515
DHFL opened at 533 and never went to 518, low for day was 525.60. However in your Performance Sheet Intraday for 07-Aug, you mention,
07-Aug Link for Calls DHFL 500 12.00 6,000.00 100.00 5,900.00 12.00 2 Tgt Done
How is this possible?
Thanks.
Dear Kumar,
Please check the cash price of DHFL
520 533 516 529 are OHLC
Rgds,
Bramesh
Dear Mr Ramesh.
Thanks, I was checking F&O as always.
Regards
Dear Kumar,
Please read the instructions given below.
Dear Mr RAMESH,
Yes, I checked that and realized my mistake. So you do intraday in cash only, not futures?
Thanks
We do not both. This analysis is shared for Retails traders who trade in cash. Traders who trade in Futures can use the cash levels as reference to enter/exit positions.
Rgds,
Bramesh
Dear bramesh ji, please send your news letter for stock analysis before 6.30am. Generally i received ur letter after 9.40am.My email mrsaroj1234@gmail.com.thanking you in anticipation. Saroj sahoo
I do not have any newsletter service