


Grasim

Positional/Swing Traders can use the below mentioned levels
Any close above 3603 stock can bounce to 3698/3804.
Intraday Traders can use the below mentioned levels
Buy above 3603 Tgt 3626,3656 and 3698 SL 3572
Sell below 3570 Tgt 3543, 3520 and 3490 SL 3590
LIC Housing
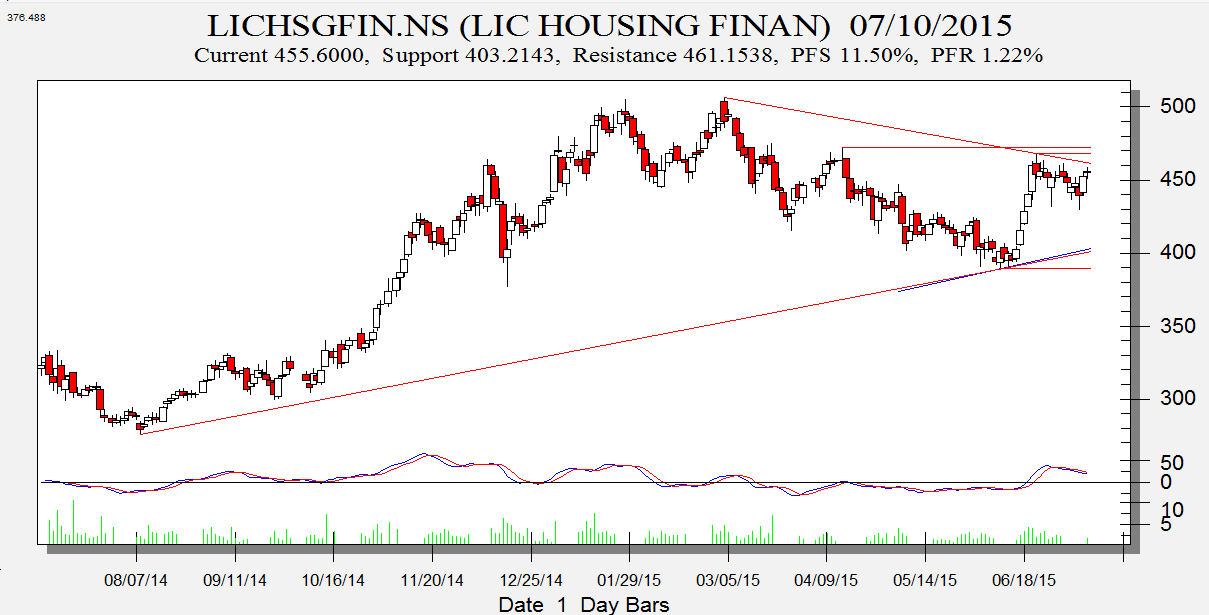
Positional/Swing Traders can use the below mentioned levels
Any close above 466 stock can bounce to 482/500.
Intraday Traders can use the below mentioned levels
Buy above 457 Tgt 459.3,463 and 466 SL 454.5
Sell below 453 Tgt 451, 447 and 444 SL 454.5
TCS
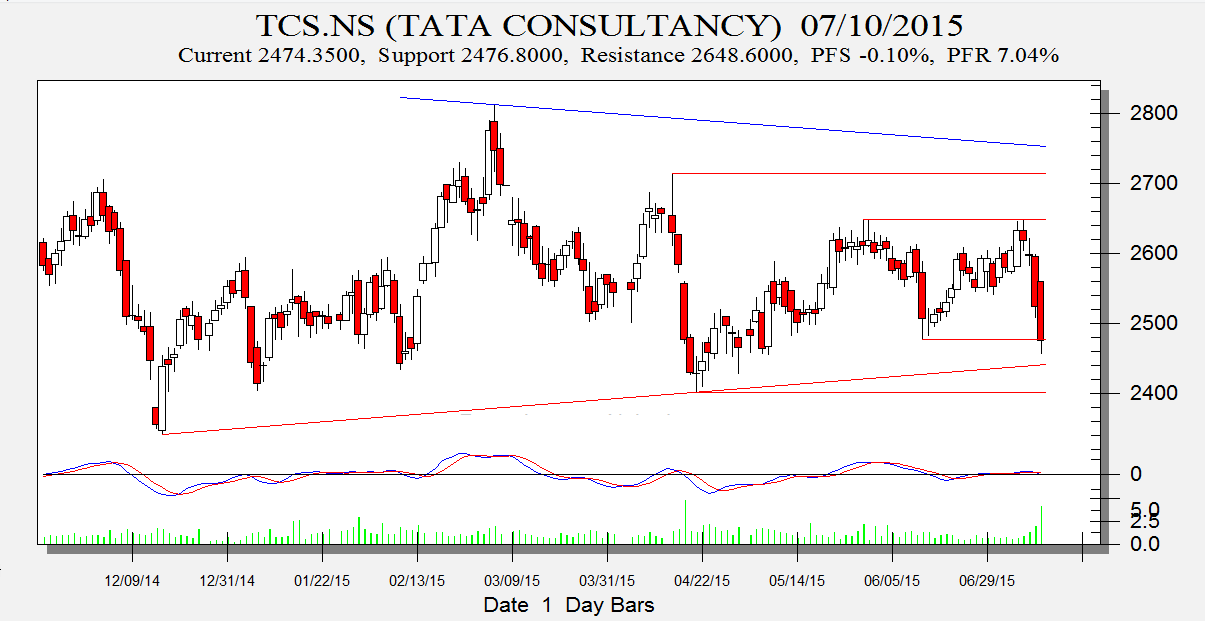
Positional/Swing Traders can use the below mentioned levels
Holding 2440 stock can bounce to 2495/2529/2584.
Intraday Traders can use the below mentioned levels
Buy above 2497 Tgt 2520,2537 and 2559 SL 2470
Sell below 2455 Tgt 2440, 2400 and 2350 SL 2470
How to trade Intraday and Positional Stocks Analysis — Click on this link
Performance sheet for Intraday and Positional is updated for June Month, Intraday Profit of 1.97 Lakh and Positional Profit of 1.93 Lakh
http://tradingsystemperformance.blogspot.in/
http://stockpositionaltrading.blogspot.in/
- All prices relate to the NSE Spot/Cash Market
- Calls are based on the previous trading day’s price activity.
- Intraday call is valid for the next trading session only unless otherwise mentioned.
- Stop-loss levels are given so that there is a level below/above, which the market will tell us that the call has gone wrong. Stop-loss is an essential risk control mechanism; it should always be there.
- Book, at least, part profits when the prices reach their targets; if you continue to hold on to positions then use trailing stops to lock in your profits.
Follow on Facebook during Market Hours: https://www.facebook.com/pages/Brameshs-Tech/140117182685863
Please also read the detailed Disclaimer mentioned in the Right side of Blog.