


Last week we gave Chopad Levels of 8156 ,Nifty made high of 8163 and did 2 target on downside rewarded Chopad followers . Lets analyze how to trade market in coming week.
Nifty Hourly Chart

As discussed last week Break of 8057 can see move towards 8016/7961 odd levels. Nifty Hourly charts with gann angles are drawn,Nifty broke the @16×1 gann line and resistance will be @8×1 @8056. Also Bull Power indicator is crossing the median line which if sustained can see relief rally coming in market till 8147/8290 odd levels.
Nifty Hourly Elliot Wave Chart

Hourly charts EW target comes @788 and if 8000 is broken on MOnday we can see fast move on upside.
Nifty Pyrapoint Analysis

As per Pyrapoint Analysis Bullish move only on Hourly close above 135 line @8060. Support @ 180 line @7914
Nifty Market Profile

Nifty as per market profile if able to cross 8027 upside target comes to 8159. Bearish below 7903 for short term target of 7829.
Nifty Gunner

As per gunner nifty is still holding 2×1 gunner line if held bulls have hope for target of 8157/8232.
Nifty Harmonic

Nifty has completed the BAT and ABCD pattern on downside. Holding lows can see bullish upside move.
Nifty Daily Elliot Wave Chart

As per EW more legs are left to the rally use dips around 8000/7900 to take exposure to quality large and mid caps stocks. NO leveraged positions this for cash market traders.
Nifty MML
Unable to cross 7971 short term target 78131. Holding above 8000 short term target 8126/8281.
Nifty Gann Date
Nifty As per time analysis 17 June/20 June is Gann Turn date , except a impulsive around this dates. Last week we gave 08 June/10 June Nifty saw a volatile move .
Nifty Gaps
For Nifty traders who follow gap trading there are 14 trade gaps in the range of 7000-9000
- 7067-7014
- 7130-7121
- 7276-7293
- 7229-7239
- 7454-7459
- 7526-7532
- 7598-7568
- 7625-7654
- 7780-7856
- 7927-7940
- 8262-8271
- 8365-8391
- 8937-8891
Fibonacci technique
Fibonacci fan

Took support @38.2%
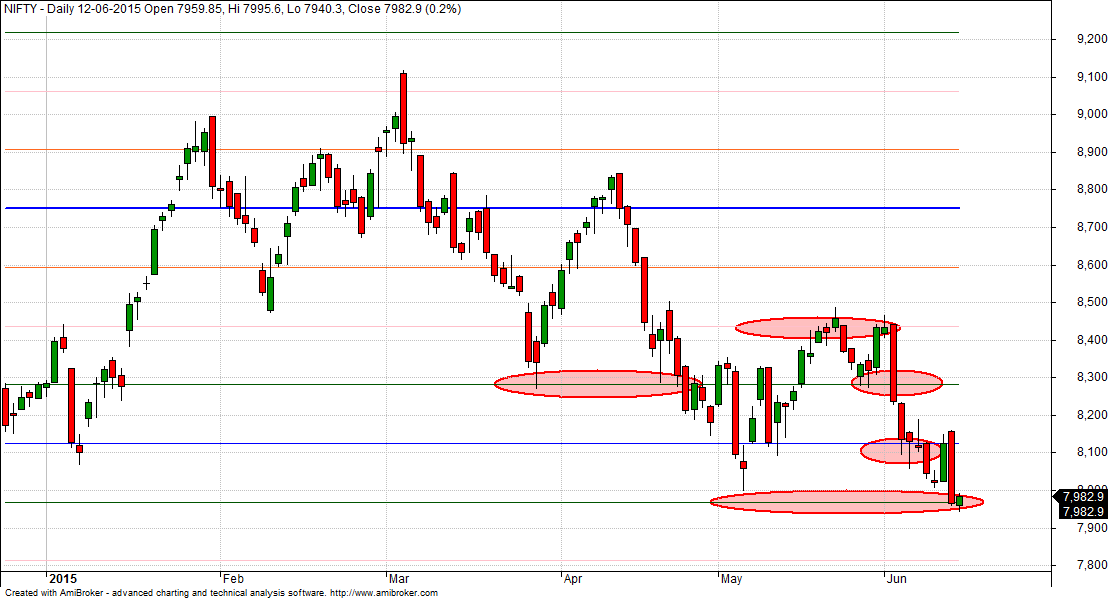
Nifty Weekly Chart

It was negative week, with the Nifty down by 131 points closing @7982 , and closing below its 20 WSMA and its 55 EMA. . Nifty has seen lowest closing of 2015 and below 8000. Weekly charts are oversold and showing divergence . Holding the low can see nifty moving intital move towards 8057 and 8232. As per time analysis next cycle from 15 June will be neutral to bullish .

Weekly Gunner

Gunner weekly charts move towards the horizontal line as discussed lat week,
Trading Monthly charts

Monthly chart broke 23.6 % retracement.
Nifty PE

As per PE ratio has again down to 22.12, Result season finally showed effect and nifty corrected almost 5% from 23 odd levels.
Nifty Weekly Chopad Levels
Nifty Trend Deciding Level:8026
Nifty Resistance:8117,8163,8251
Nifty Support:7894,7806,7755
Levels mentioned are Nifty Spot
Let me go by Disclaimer these are my personal views and trade taken on these observation should be traded with strict Sl.Please also read the detailed Disclaimer mentioned in the Right side of Blog.
Want to see post in your Inbox,Register by adding your email id in Post in your Inbox section
Follow on Facebook during Market Hours: https://www.facebook.com/pages/Brameshs-Tech/140117182685863
Dear Bramesh – Looking at daily Elliot wave progress, how possible is it that the 5 wave upmove that started in Sep 2013 has actually ended and we are in correction mode.
Also it seems the wave 4 for rally starting March 2009 in in process so a secular upmove might only start sept/oct onwrads that can last till Q1 2017. Your thoughts please…………
Every one has different view on EW…
Dear Bramesh
I saw your blog just yesterday only
Your prediction on nifty is amazing as
I keep track of all of our big players like
ICICI, Sharekhan, SMC, Most, Angle
But none predicted it right for today
As you said on nifty direction today
they should know abcd of technical
and also bat should fly (trend-reversal)
i doubt nifty will hold above 8000 as
7800 put is getting heavier day by day
Keep up the good work and Kudos 2u
Rgds
Sankar
Dear Bramesh…looking at Nifty daily Elliot wave chart, how possible is it that the 4th and 5th waves have already completed (considering Nov 2014 end as EW3 and March start as end of EW5) and in fact we are in correction mode that might last till august start or perhaps september end…….your views please. MG
Thank you for the Article bramesh ji.
As per the Time cycle, now the bias is Neutral to bullish from 15th june onwards ,till when is this time cycle Going to continue , i mean is it till 19th june only or more than that.
Thank you !!
Will be updated accordingly in next analysis.
Rgds,
Bramesh
Atul, Mkt is sum /total of every aspect taking into account. I feel as long as there is no solution to the MAT problem FII will be in arm twisting mode. Govt will slowly dilute the issue. FII=DII is not the only factor. Selling by FII is more hyped by media. Sentiment is the biggest factor so saavy investors wait for pessimism to prevail. Traders use both the directions to their advantage. This is how I take the market in my stride.
Ok sir got it. Thank you
Amazing analysis…i m ur regular blog from dubai..plz throw some light on which charting software to use..and pc config accordingly sir..
Thanks !! Start with Basic Chartnexus and Amibroker
Bramesh, in the Nifty Hourly Elliott Wave pattern, (c) cannot be lower than start of the Motive wave. Could you number the Motive wave for better understanding? I think you have marked the low of May as the starting of Motive wave, but then (c) predicted by you will be less than that. Could you please clarify?
Sure it seems chart did not get updated correctly. WIll Work on it.
Rgds,
Bramesh
Sir, I’ve a doubt that why markets eyes on FII’s negative data whereas we’ve positive data from DII’s. Almost equal amount of FII’s selling is bought by DII’s. Then even though why market is headed downwards?
FII bring market down by trading in derivatives. DII cannot take derivatives route to trade on aggressive manner due to SEBI restrictions.
Rgds,
Bramesh
Thanks for the valuable information sir.
Seasonal Time by degree change date must be 21st
June
Thanks for the input !!
Sir it means if we buy Nifty above 8026 according to weekly chopad level , SL will be 7894 which is nifty 1st support ?
SL 20-25 points.
Reverse positions if SL get triggered, 2 time SL gets triggered no further trade to be taken on the day.
Very nice bramesh sir.
If i get gunner levels of
Tcs & infosys
If the levels of these stocks persist to gunner chart plz keep us strategy.
thanks.
Quiet tied up with my analysis and training. Will try to analyze in free time.
Hi Brahmesh,
The above-Nifty charts cannot be enlarged.
Can you add a ZOOM ?
Sam
Right click on image and select “Open image in new tab”
Thanks Vivekji
Last week was -ve. but here for this week you mentioned from neutral to bullish instead of -ve to bullish … How?
Time cycle have changed for coming week
How can i used chopped level?Also explain for gap up/down opening?
@bvivek88Vivek .. always consider this in +/-1 day. In this case this could be on Firday (19th June)
Gann date of 20-June falls on a saturday?