


Many traders value time equally to price as a forecasting tool. The Aroon indicator is an important strategy for exploiting both. Aroon-based indicators differ from other price momentum oscillators in that they don’t just focus on price changes; they measure price changes relative to time. This article will examine the logic behind Aroon and show when it works best.
Introduction
The Aroon indicator is another from leading market technician, Tushar Chande, who is responsible for a number of books and popular technical indicators used all over the world . The Aroon can be used to find the likely direction of a forex,stocks and commodity on several different timeframes.
Chande designed the indicator back in 1995 and since then it has been an effective but not so widely used tool among traders (compared to his other indicators).
The indicator consists of two lines, Aroon up and Aroon down, to show market direction and in some respects, bears many similarities with the directional movement index (DMI) by J Welles Wilder.
The term ‘Aroon’ is a Sanskrit word and means “dawn’s early light”. The term obviously refers to the fact that the Aroon indicator is able to signal trend changes early.
The two lines of the Aroon indicator form the basis of any trading strategy when using the Aroon and each line is given a range between 0 and 100.
Aroon up shows how upward strength in the market is being tracked and thus indicates whether the market will be upward moving or downward moving. Aroon down shows downward strength.
The best way to use the indicator is to use it as a type of filter. In other words, longs should only be taken when Aroon up is above Aroon down and shorts should only be taken when Aroon down is above Aroon up. The standard period for the Aroon Up and Aroon Down is 25-periods.
Calculating Aroon
The Aroon indicator can be calculated using the following formula:
Aroon-Up = ((25 – Days Since 25-day High)/25) x 100
Aroon-Down = ((25 – Days Since 25-day Low)/25) x 100
If we take a look at these formulas, it is apparent that they are both looking at how recent the latest highs and lows were. Higher Aroon values indicate more recent highs and lows, while lower values indicate less recent highs and lows. Moreover, the Aroon values oscillate between 100 and 0 – a higher number indicates a stronger trend and vice versa.
The two Aroon indicators (bullish and bearish) can also be made into a single oscillator by making the bullish indicator 100 to 0 and the bearish indicator 0 to -100 and finding the difference between the two values. This oscillator then varies between 100 and -100, with 0 indicating no trend.
Trading Rules – Aroon Indicator
There are some very basic rules that traders can use by analyzing the relationship between the Aroon Up and Aroon Down. There are three basic rules:
(1) Extreme readings
(2) Parallel movement between Aroon Up and Aroon Down
(3) Crossovers between Aroon Up and Aroon Down.
Extreme Readings
The Aroon indicator has a maximum value of 100 and a minimum value of 0. When the Aroon Up reaches 100, it is an early sign that traders are overly bullish and a counter move is likely. Conversely, when the Aroon Down reaches 100, it is an early sign that traders are overly bearish and a bounce is in order. Buying and selling these extreme readings works best in markets that are range bound. In trending markets, the Aroon lines will hover around 100 for a number of sessions. This is an indication that the current move is impulsive. During these impulsive moves, traders should add to their positions on any counter moves
Parallel Movement
When the Aroon Up and Aroon Down lines run parallel to each other, it is a sign that the security is in a sideways consolidation period. This is often the case before a pending breakout. Traders should wait for the price and volume to increase in the security prior to initiating any new positions.
Crossovers
When the Aroon Up crosses above the Aroon Down, it is a sign of a potential bullish move. Conversely, a cross of the Aroon Down through the Aroon Up implies a bearish move is underway. In choppy markets Aroon line crossovers will generate a number of false signals, so traders should use other indicators to confirm the strength of the cross.
Lets take example to elaborate each of the above scenario:
- Extreme Reading
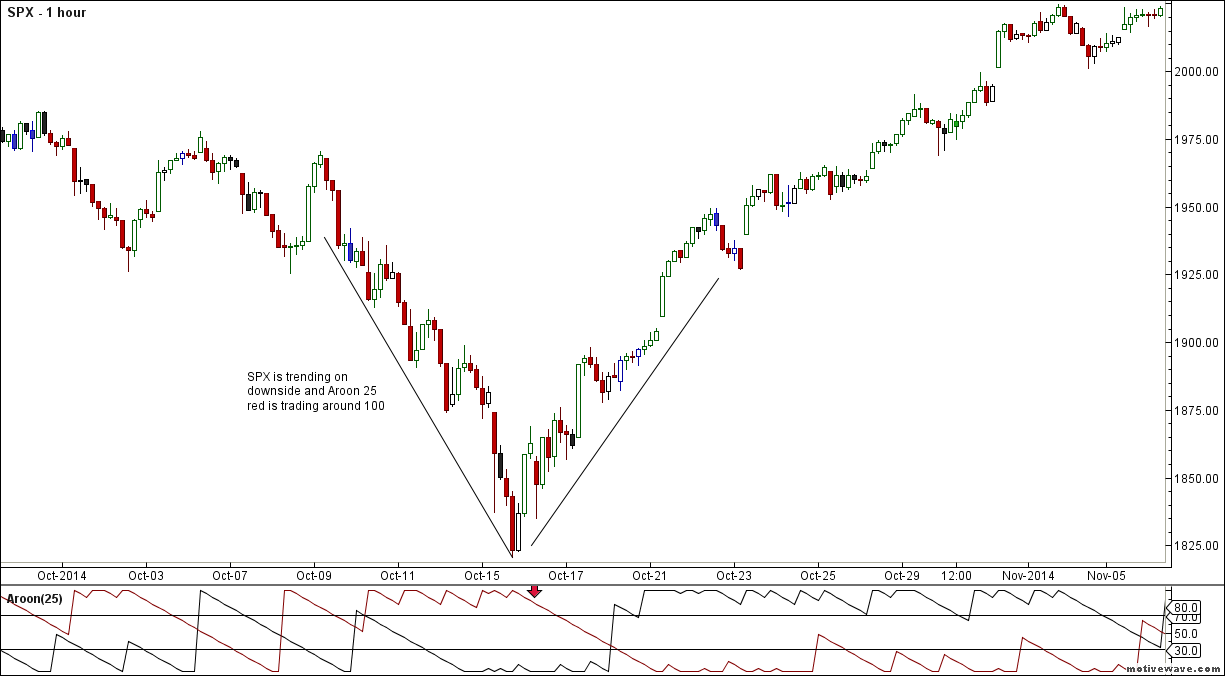
As seen in above chart S&P 500 is down trending on Hourly charts and Aroon 25 Red is consistently trading in 100 range, signalling extreme reading and a bounce back is on cards. As soon as 70 is broken on Aroon 25 on downside its signalled relief rally is on way, So traders should cut short positions and go long. It is important to realize when looking at these charts that the Aroon indicator is lagging and, therefore, is susceptible to sharp price drops or increases. Therefore, it is very important to use other methodologies in order to exit prudently.

- Parallel Movement
The Aroon indicators signal a consolidation when both are below 50 and/or both are moving lower with parallel lines. It makes sense that consistent readings below 50 are indicative of flat trading.
The chart above shows The International Business Machines Corporation (IBM) with the Aroon indicators moving below 50 in a parallel decline. The width of the channel could be narrower, but we can see the consolidation taking shape on the price chart for confirmation. Both Aroon-Up and Aroon-Down were below 50 in the yellow area. Aroon-Red then broke out and surged to 100, which was before the breakdown. Further confirmation came with another Aroon-Up down surge at the breakdown point. This breakdown signalled the end of the consolidation and the beginning of the decline.

Crossovers
Crossovers indicate confirmations if they occur between 30 and 70. For example, if the bullish indicator crosses above the bearish indicator, it confirms a bullish trend.
In the chart above of Chevron Corporation (CVX daily chart, with the Aroon indicator. We can clearly see that Aroon Up has crossed over Aroon down around 30. This signal indicates that momentum of the CVX has shifted and a new uptrend trend is developing. Traders following Aroon Indicator then will expect price to continue to rise as its a Bullish Crossover.

Conclusion
The Aroon indicator is used best by traders and investors interested in whether or not a trend is still intact. It can help traders avoid inefficient use of capital by allowing them to seek other opportunities during sideways markets and only hold positions during strong trends. Chartists can use the Aroon indicators to determine if a security is trending or trading flat and then use other indicators to generate appropriate signals. However, it is important to watch carefully and analyze stocks using other studies in conjunction with Aroon to avoid the primary weakness in this system – sharp price movements.
Love using this Indicator. Have really been successful buying at extreme low, Aroon Down 100 and selling at extreme high, Aroon Up 100. Tweeked the sell rule by setting a limit sell at (monthly) Fibonacci R3 level. In past eight weeks my portfolio is up +25%. Only Trade ETF’s and sometimes leveraged ETF’s.
very useful article and its nicely explained
Hi Bramesh ji nice article I have small doubt on NSE website OI data file is missing any problem in this section
Rameshji,
On the days used for up/down indicator calculation, does the formula take calendar days or the trading days?
Very clear and detailed explanation. Kudos Ramesh ji.
On similar lines with the same analysis, Aroon up /down crossover shows an uptrend for NIFTY very soon.
Grt sir nice article can we get some books or we can get a deeper view on all these kind of indicators so we can study the sme