


Bata India

Positional/Swing Traders can use the below mentioned levels
Any close below 987 short term target 966/953.
Intraday Traders can use the below mentioned levels
Buy above 995 Tgt 1005,1012 and 1030 SL 990
Sell below 987 Tgt 975,965 and 956 SL 992
IGL

Positional/Swing Traders can use the below mentioned levels
Any close below 385 short term target 377/369.
Intraday Traders can use the below mentioned levels
Buy above 388 Tgt 391,395 and 399 SL 385
Sell below 383 Tgt 380.5,376 and 370 SL 385
HDFC
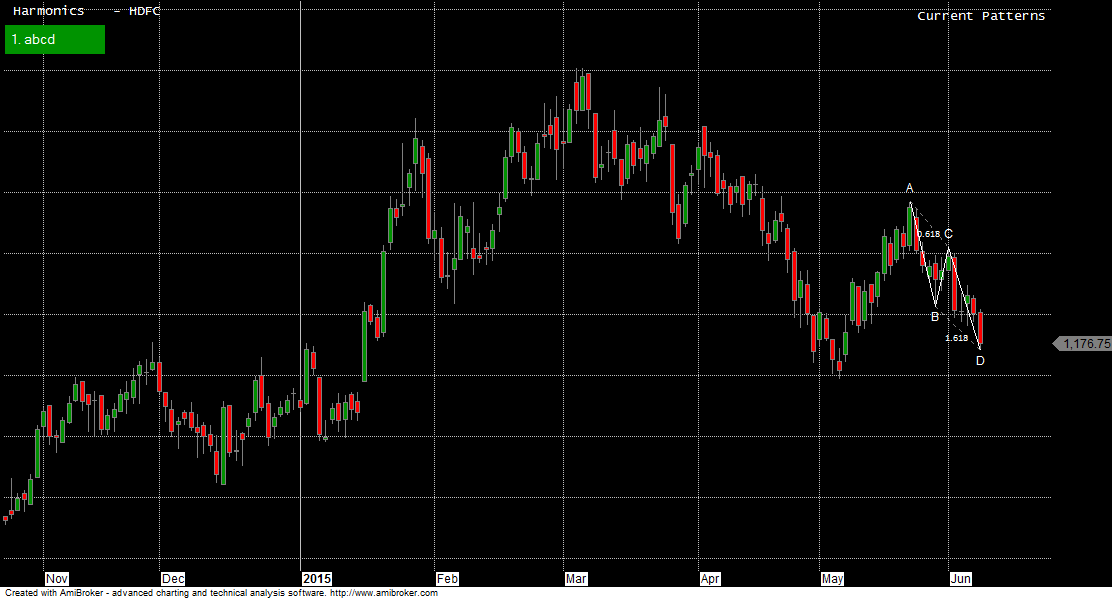
Intraday Traders can use the below mentioned levels
Buy above 1185 Tgt 1197,1205 and 1218 SL 1177
Sell below 1170 Tgt 1164 ,1150 and 1130 SL 1177
How to trade Intraday and Positional Stocks Analysis — Click on this link
Performance sheet for Intraday and Positional is updated for May Month, Intraday Profit of 2.32 Lakh and Positional Profit of 2.07Lakh
http://tradingsystemperformance.blogspot.in/
http://stockpositionaltrading.blogspot.in/
- All prices relate to the NSE Spot/Cash Market
- Calls are based on the previous trading day’s price activity.
- Intraday call is valid for the next trading session only unless otherwise mentioned.
- Stop-loss levels are given so that there is a level below/above, which the market will tell us that the call has gone wrong. Stop-loss is an essential risk control mechanism; it should always be there.
- Book, at least, part profits when the prices reach their targets; if you continue to hold on to positions then use trailing stops to lock in your profits.
Follow on Facebook during Market Hours: https://www.facebook.com/pages/Brameshs-Tech/140117182685863
Please also read the detailed Disclaimer mentioned in the Right side of Blog.
hello sir
sorry to ask you, today you posted free calls after 9.15 AM
regds
Yes today was having n/w issues so posted at 9:18