


Last week we gave Chopad Levels of 8286 , Nifty did 2 target on downside and rewarded Chopad followers. Lets analyze how to trade market in coming expiry week.
Nifty Hourly Chart

Nifty Hourly charts has broken on downside and below its 21/34 EMA, till 8309 is not broken trend remains on downside. We are also entering supply area as shown in above chart.
Nifty Hourly Elliot Wave Chart
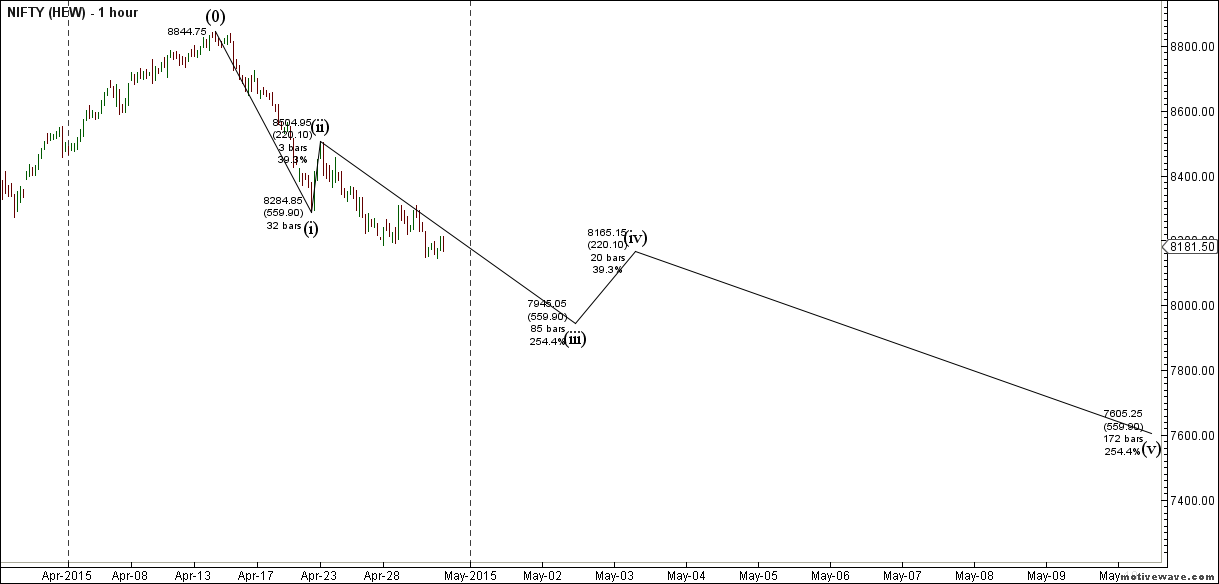
8120/8140 will play a vital role in coming week, Holding the same we can see 8250/8309 and below it nifty can move to 8065/7965 range.
Nifty Pyrapoint Analysis

As per Pyrapoint Analysis unable to sustain above its 180 degree line, suggesting move towards its 225 degree line which lies near 8105.
Nifty Market Profile

Nifty as per Market profile 8230 should be closely watched in coming week,unable to cross we can see downside till 7905 odd levels
Nifty Daily

Nifty for 2 day in row has closed below its 200 DMA,suggesting selling pressure at higher levels.
Nifty Gunner

ON Daily chart Nifty Gunner is entering in green arc, any break below 8120 ie break of green arc will see move towards 8000. Holding the same 8309 is on cards.
Nifty Harmonic

If butterfly pattern needs to form Nifty should bounce sharply in coming week till 8400/8600.
Nifty Daily Elliot Wave Chart
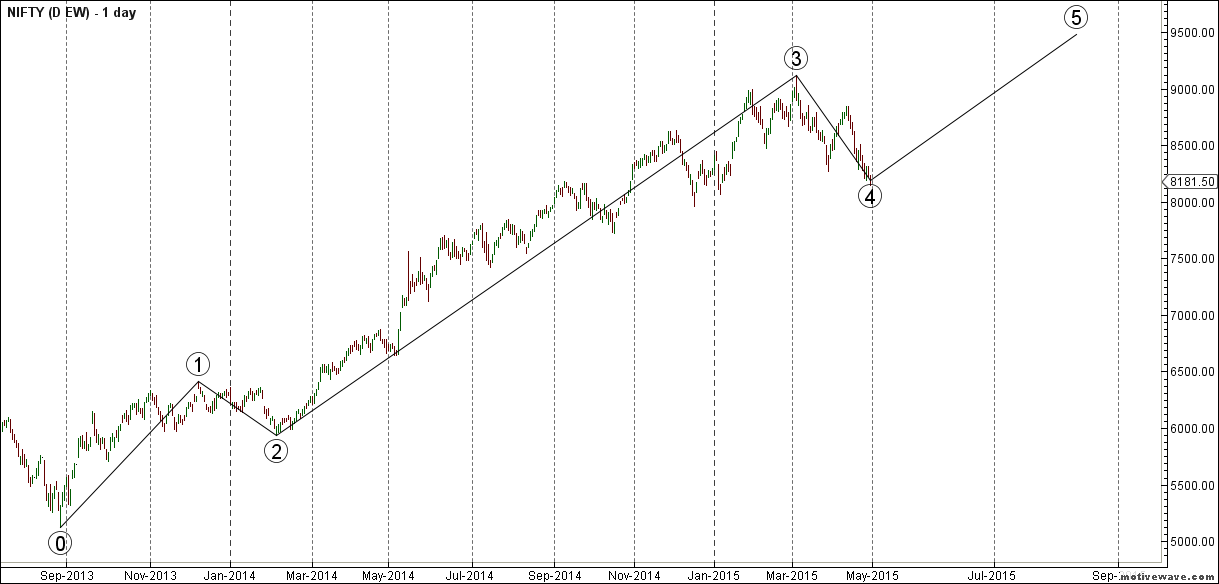
As per EW more legs are left to the rally use dips around 8200/8165 to take exposure to quality large and mid caps stocks. NO leveraged positions this for cash market traders.
Supply and Demand Zone
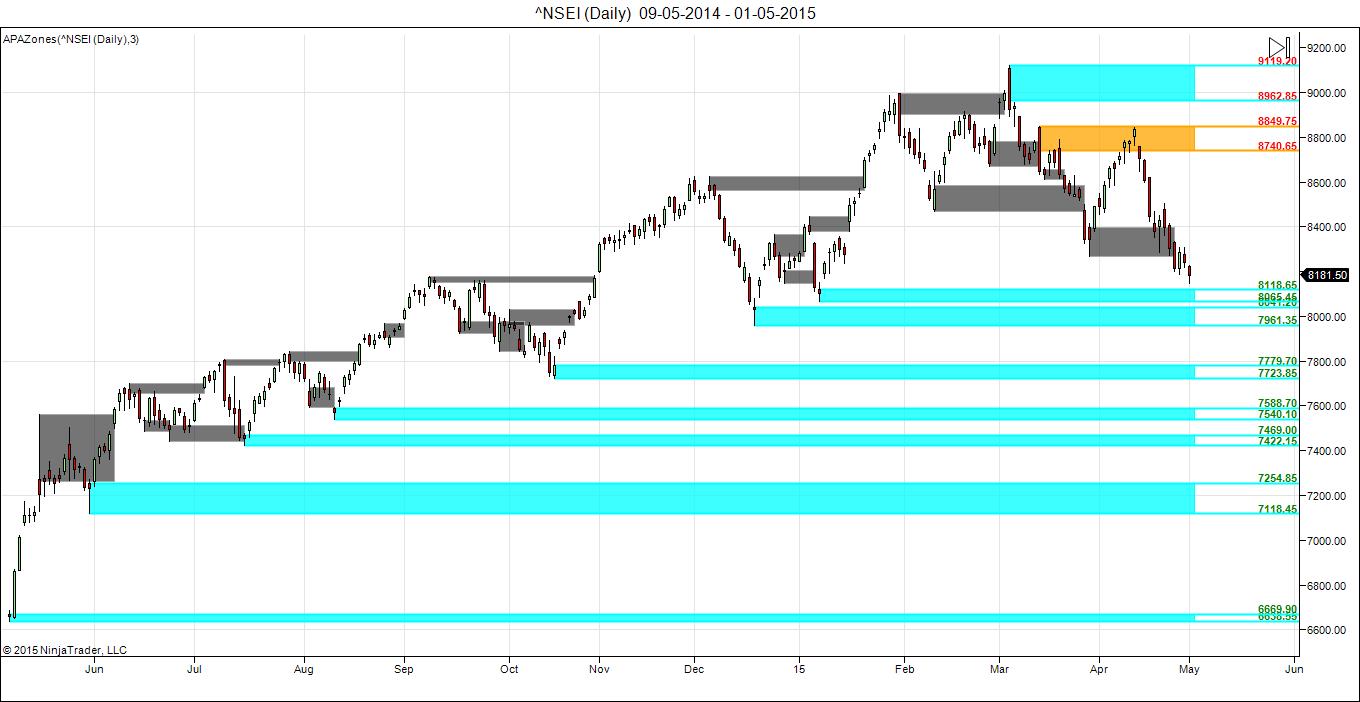
Self Explanatory chart for Supply and Demand zone.
Nifty MML

Murry Math line support at 8125, break of same can see move towards 7972. 8281 is upper side target as per MML
Nifty Gann Date
Nifty As per time analysis 04 May/06 May is Gann Turn date , except a impulsive around this dates. Last week we gave 27 April Day Nifty saw a volatile move .
Nifty Gaps
For Nifty traders who follow gap trading there are 14 trade gaps in the range of 7000-9000
- 7067-7014
- 7130-7121
- 7276-7293
- 7229-7239
- 7454-7459
- 7526-7532
- 7598-7568
- 7625-7654
- 7780-7856
- 7927-7974
- 8029-8065
- 8102-8144
- 8937-8891
Nifty Andrew Pitchfork

Holing the median line suggests bulls have hope.
Fibonacci technique
Fibonacci fan

Nifty near its Fibo fan support so next week we need to see do we get the follow up move.
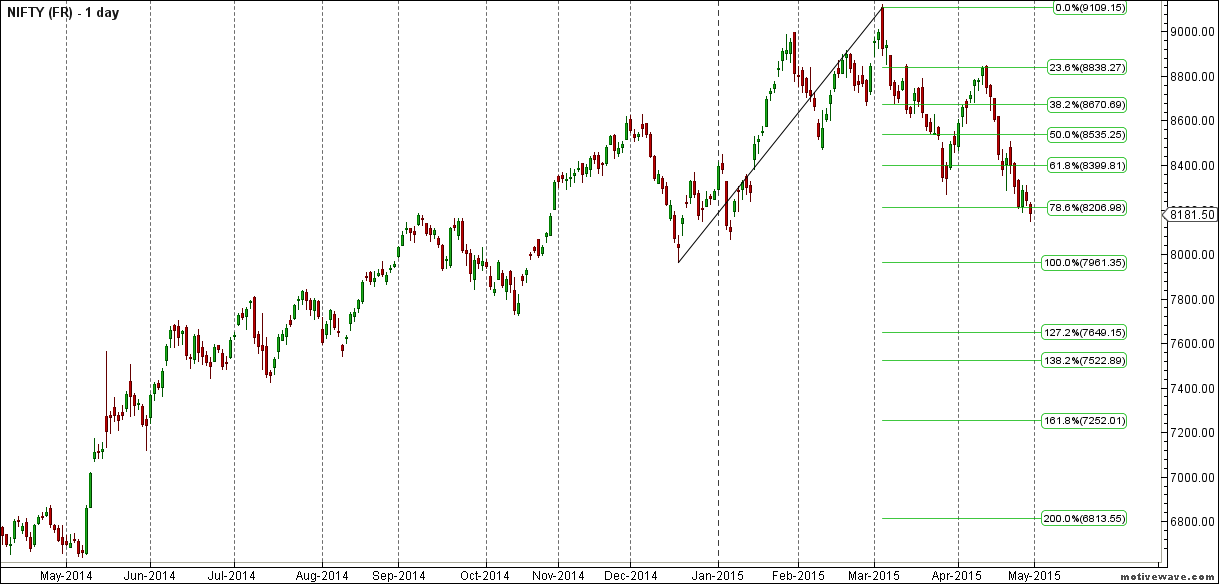
8208 is 78.6% retracement number so keep a eye on this.
Nifty Weekly Chart

It was negative week, with the Nifty down by 123 points closing @8181 , and closing below its 20 WSMA and broken its its weekly channel for second time in 3 weeks suggesting supply pressure at higher levels.Also taking support at its 50WSMA As discussed last week Nifty has broken the red arc of gunner which has bearish implication if nifty do not close above red arc in coming week. Entering new quadrant as per time analysis so exciting week ahead


Trading Monthly charts

Monthly chart took support near 23.6% retracement line.
Nifty PE

As per PE ratio has again up to 22.07, Result season is going bad unable to upgrade the earning can see nifty moving in bubble category.
Nifty Weekly Chopad Levels
Nifty Trend Deciding Level:8221
Nifty Resistance:8295,8335,8416
Nifty Support:8106,8026,7920
Levels mentioned are Nifty Spot
Let me go by Disclaimer these are my personal views and trade taken on these observation should be traded with strict Sl.Please also read the detailed Disclaimer mentioned in the Right side of Blog.
Want to see post in your Inbox,Register by adding your email id in Post in your Inbox section
Follow on Facebook during Market Hours: https://www.facebook.com/pages/Brameshs-Tech/140117182685863
Dear Sir,
I fully agree Reena dat how one can be bullish & bearish both at the same time?
You give your analysis by Chopad,Pyropoint,135 degree,Gann,Gunner, Harmonic and many more methods. How we small traders can make money by these both sided analysis ? Leave money, even we can not ot learn anything because its like Khichdi analysis.
Kindly give one sided trade or view, doesnt matter that its going right or wrong but dat will be highly appreciated.
Dear Rajeevji,
There are 2 kind of traders
1. Who wants ready made levels and just blindly trade on them with out understanding the basis of it. For this i made chopad levels and they are very well tradeable if you follow them with discipline.
2. I have many readers who are institution/HNI traders and they are least bothered above levels but more interested in analyzing from different perceptive available as part of TA so that’s where they get the “EDGE”. For you it might look like “Khichdi analysis” but for many its analysis which help them to get an EDGE and prepare for any surprising move market can give.
We need to prepare for all scenarios and i never gave one sided view, as GOLDEN RULE of trading is preserving your capital not get wiped off with one sided view. Trading is note about “BEING RIGHT” but “TRADING RIGHT”.
Again i would reiterate its your hard earned money if you feel you are not getting right view please ignore my analysis.
Rgds,
Bramesh
hi Bramesh please check bullish nifty levels given by you after the hourly Elliot eve chart
what the others think about your comments , but one thing i have to say that you are ahard worker nd also no one is giving so mutch time to nifty , i dont know that either you are earning from nifty or not. .. gsushil 54@yahoo.com
sorry for above comments…….
Break below 8120 i will be ready to short sell.. but 8181 to 8125 is no trade zone.. or small buy @ 8135 with a strict SL of 8118. As the risk reward ratio is good on that level if i m not wrong..
Very nice bramesh bhai,
Any close above 8221 & 8309 willgive up side momentum thats noted..
in april series many stocks came down
wockhart, cipla, dlf, hdfc, auropharma, cipla, abnuo, infosys, tcs and L&T.. please extend levels for above large cap stocks positional / intraday at your convineance..
thanking you..
Thanks Pujan Will try to analyses as and when time permits.
Rgds,
Bramesh
again sir two way comments..how can be bullish and bearish at the same time….
That’s the way tech analysis works.
Dear Reenaji,
Trading is all about probabilities, and we need to trade those probability as market shows the move. As i told you last time also if you are getting confused the way i analyses please stop reading it as its your hard earned money at stake.
Rgds,
Bramesh