


Overview
The McClellan Oscillator is a market breadth indicator that is based on the smoothed difference between the number of advancing and declining issues on the New York Stock Exchange. The McClellan Oscillator is a popular market “breadth” indicator that can be used for market timing for short term traders. This indicator can give traders a true sense of what is happening under the surface in the stock market. The McClellan Oscillator is one of the most popular breadth indicators.
The McClellan Oscillator was developed by Sherman and Marian McClellan. Extensive coverage of the oscillator is provided in their book Patterns for Profit
Understanding Breadth of Market
Breadth refers to the fraction of stocks that are participating in an up or down move in the market. For example, if a large number of stocks are participating in an down move in the market then we can interpret this as being bearish. If, on the other hand, only a small number of stocks are making an down move in the market, then we can interpret this as being bullish. A healthy bull market is accompanied by a large number of stocks making moderate upward advances in price. A weakening bull market is characterized by a small number of stocks making large advances in price, giving the false appearance that all is well. This type of divergence often signals an end to the bull market. A similar interpretation applies to market bottoms, where the market index continues to decline while fewer stocks are declining.
Calculation
The McClellan Oscillator is the difference between 10% (approximately 19-day) and 5%
(approximately 39-day) exponential moving averages of advancing minus declining
issues. It is plotted against the movements of a particular exchange.
Ratio Adjusted Net Advances (RANA): (Advances – Declines)/(Advances + Declines)
McClellan Oscillator: 19-day EMA of RANA – 39-day EMA of RANA
19-day EMA* = (Current Day RANA – Prior Day EMA) * .10 + Prior Day EMA)
39-day EMA* = (Current Day RANA – Prior Day EMA) * .05 + Prior Day EMA)
Let’s look at a chart of the SPX with the McClellan Oscillator below it.

Trade using McClellan Oscillator
McClellan Oscillator can be used in trading using the below
- Divergences
- Overbought/Oversold levels
- Breadth Thrusts
Let discuss all 3 in details
- Overbought/Oversold levels
The McClellan Oscillator generates the Buy and Sell Signal as follows
- Buy signal when it falls into an oversold area of -70 to -100 followed by a turn back up.
- Sell signals occur if the oscillator rises into an overbought area of +70 to +100 and then subsequently turns down.
Extreme overbought/sold conditions (outside -100 and +100)
If the oscillator goes beyond these areas (i.e., rises above +100 or falls below -100), it is a
sign of an extremely overbought or oversold condition. These extreme readings are usually a sign of a continuation of the current trend.
For example, if the oscillator falls to -90 and turns up, a buy signal is generated. However, if the oscillator falls below -100, the market will probably trend lower during the next two or three weeks. You should postpone buying until the oscillator makes a series of rising bottoms or the market regains strength.
Buy signal

As seen in below chart S&P 500 went in oversold zone and turn up signalling a Buy which should be sold once the McClellan Oscillator turns back in overbought zone.
Sell Signal
As seen in below chart S&P 500 went in overbought zone and turn down signalling a Sell which should be bought once the McClellan Oscillator turns back in oversold zone.

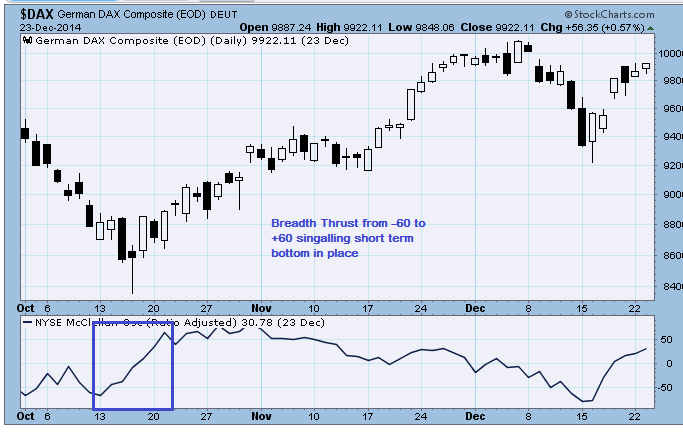
- Breadth Thrusts
A breadth thrust occurs when the McClellan Oscillator surges from deep negative readings to strong positive readings. Typically, the indicator will move from below -50 and exceed +50 for a +100 point thrust. A breadth thrust signals a surge in bullish breadth that can lead to an extended advance and formation of short term bottom. Not all breadth thrusts foreshadow extended advances, but most important lows are marked by a sharp surge in breadth.
The chart below shows the DAX with McClellan Oscillator during the October 2014 bottom. Notice how the McClellan Oscillator surged more than 150 points (-50 to +50). This surge reflected strong buying pressure that marked an important low. Think of it as a rocket on lift off. A strong surge is needed to solidify a low and escape the gravity of selling pressure. Also notice that the DAX continued higher till December 2014.
- Divergences
Bullish (Positive) and Bearish (Negative) Divergence in the McClellan Oscillator can foreshadow reversals in the underlying index.
Identifying the Divergence
First, a divergence should be confirmed with a strong supporting move. A bullish divergence is confirmed with a strong move into positive territory. A bearish divergence is confirmed with a strong move into negative territory. Second, divergences should be sharp. The difference between the reaction highs or lows should be noticeable, not negligible.
Do note There will be many divergences and most will not result in reversals or extended moves.
The chart below shows the Nifty 50 Index and McClellan Oscillator with a sharp bearish divergence in April 2015. Even though the Nifty moved to a new high in April 2015, the McClellan Oscillator formed a sharply lower high. The subsequent move into negative territory in april end showed a significant increase in selling pressure.

Conclusions
The McClellan Oscillator measures the momentum of the AD Line or Net Advances. As a momentum oscillator, it is prone to the pitfalls of normal momentum oscillators, such as MACD. Bearish and bullish divergences can produce some great signals, but these signals are certainly not fail-proof. The same is true for breadth thrusts and crosses into negative or positive territory. Like MACD, the McClellan Oscillator is a rather volatile indicator that produces many potential signals. Signals should be confirmed or refuted with other technical indicators and chart analysis. Chartists can also study past behaviour to get a better handle on future behaviour.
thanks a lot bramesh ji, wonderful tool to explore, thanks, have a nice day
Satish & Naresh – It can be plotted in Excelsheet or even Amibroker & I post it almost daily on my blog.
Dear rishi what is ur blog name?
rishi, sir kindly post ur blog, thanks
gr8
Does this indicator applies to Indian stock market
How to get indicator, can u guide us
This is good, but RSI( relative strength index) is best.
this indicator is not available in indian technical softwares.
sir can u give overview on( ADX average directional index) with examples.
thanks.
How to get this indicator for free sir