


There are certain characteristics of the markets that take place almost all the time, when the indexes are about to approach an intermediate or long-term top or long term bottom. In order of importance, this is what you have to look at to identify market tops.
- Time
- Sentiment or Investors Expectations
- Market Breadth
- Price patterns
- Time Profiles: Major tops/bottom are made after the markets have been going up/down for an extended long period of Time. Indian Market follow the 8 year cycle , Major Tops are formed after 8 year, 1992,2000,2008 have been the major tops in Indian market. Next 2016 is on the line, so investors should be cautious in 2016 going by historical data. But time alone will not give you the sufficient information you need to identify market tops. All of the key identities must be in place at or near major market tops.
- Sentiment or Investors’ Expectations will always be high at or near market tops. Have you noticed the sentimanent for Banks stocks near Jan period, no one was talking about shorting banks stocks media was going “gung ho” about banks taking lead. 30 Jan 2015 was top formed in Bank Nifty. Extreme sentiment is always an attribute of a market turn or top but, by itself, is not a determinant of the turn. One of the key tells of a market top, is for Sentiment to change dramatically just after a price high and when the technical start to turn down.
Big market extremes are characterized by Changes in the Minds of Investors. One of the most difficult aspects of this methodology is to determine the degree or scale of the Market Sentiment or how big an extreme is being made. Often high sentiment only leads to pullbacks, but by merging the Sentiment Analysis with the Technicals, one can have a better grasp of this. Thus, if the Technicals are diverging or reversing on a daily as well as a Weekly basis, probabilities favor a more important change in the Sentiment.
- Market Breadth. There are a number of ways to monitor the market breadth, but the one thing that has always marked market tops, is a divergence between the NSE AD (NSE Advance-Decline Issues) . A divergence is when the NIFTY heads to new highs as the NSEAD fails to make a new high. This divergence has shown up at every market top during our 8 year time period.
The chart below illustrates these negative divergences. We have never had a true major top without this divergence.

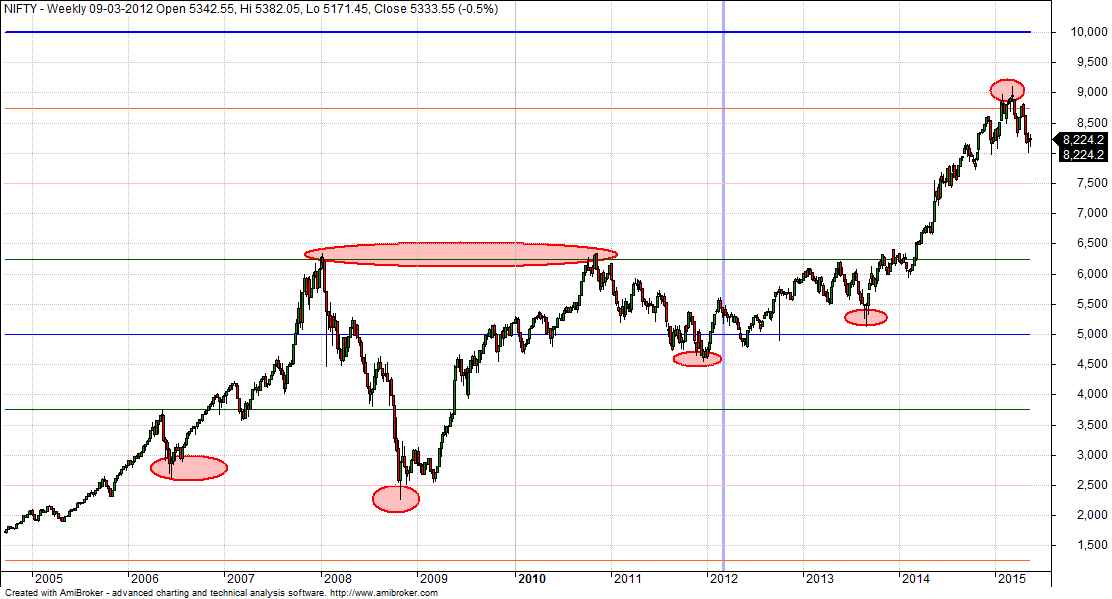
- Price and Price Patterns: There are certain price patterns that typically take place at market tops. Very rarely will you see a major top form from the exact last high. Tops are a process and take time to form. Once a top is in place, you will almost always see the bulls try and test that high again. When it fails to make a new high, that is when you can consider a major top is in place. Below is a chart of the NSE tops and Bottom.
When looking for major tops / bottom in the markets, all of the elements above must be in place. If one is missing, you must leave the door open that the major top is not in place yet.
nifty csll put provide sir
hi sir, i appreciate your articles and consider you as my mentor,but as a layman i dont understand such tough reading,could you please tell me whether top is formed or bottom is formed based on whatever you hv written, i mean the likelihood and the probability, no one can say for sure, so just keen to know ur view
We have mentioned the points, please apply them and see how its going,
i think another 15 months nifty target near 4400 and sensex 14500target possible sir. indian history in bear market nifty not trade 10.5 pe . 1380 X12 = 14500. any charts suggest my target
Hi bramesh.read market calls.in where vix fix indicator also is a good indicator of tops and bottoms
THanks will go through it..
Nice article…and Analysis…
Thanks and keep up Ur good work.
good stuff thank you, the question is was 9120 the high or is there more to come?, valuations were pretty stretched at 9120, with a p/e of almost 24.5.
Rajeev, If you study last 8 years monthly chart, you will see that the high may end up at around 9250, before retreat starts.
Regards