


Cairn

Intraday Traders can use the below mentioned levels
Buy above 196 Tgt 197.2,199.7 and 201.1 SL 194.7
Sell below 194.4 Tgt 193.3,191.9 and 189.4 SL 195.5
Tata Motors
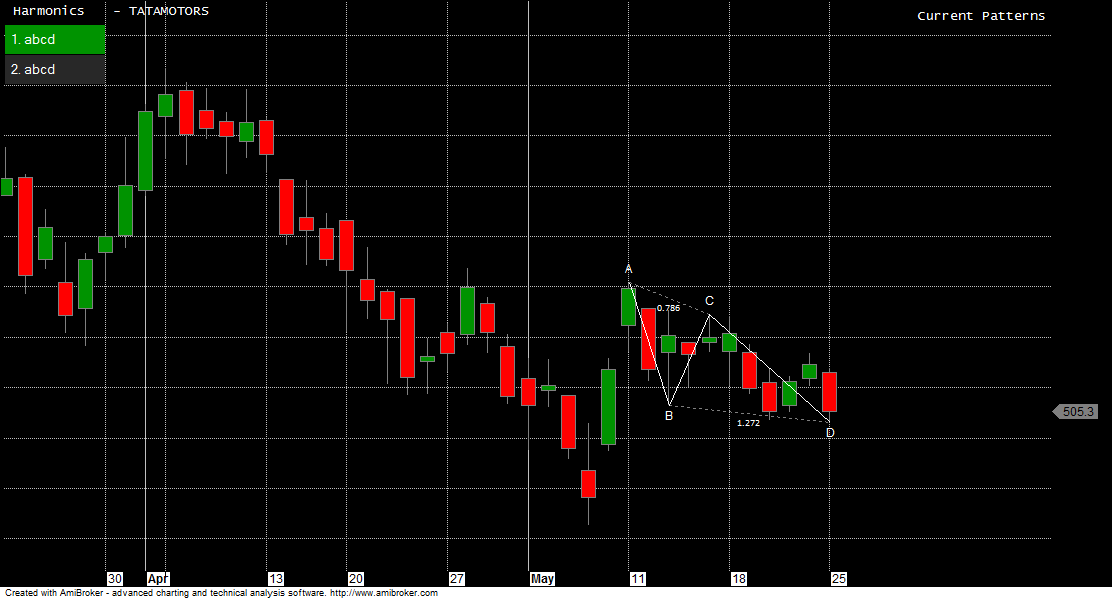
Intraday Traders can use the below mentioned levels
Buy above 507.5 Tgt 511,514 and 518 SL 505.3
Sell below 503 Tgt 501,496.5,490 SL 505.3
Bank India

Intraday Traders can use the below mentioned levels
Buy above 205.2 Tgt 207,209 , 212 and 220 SL 203
Sell below 200 Tgt 198,196,190 and 185 SL 203
How to trade Intraday and Positional Stocks Analysis — Click on this link
Performance sheet for Intraday and Positional is updated for March Month, Intraday Profit of 2.26 Lakh and Positional Profit of 2.66 Lakh
http://tradingsystemperformance.blogspot.in/
http://stockpositionaltrading.blogspot.in/
- All prices relate to the NSE Spot/Cash Market
- Calls are based on the previous trading day’s price activity.
- Intraday call is valid for the next trading session only unless otherwise mentioned.
- Stop-loss levels are given so that there is a level below/above, which the market will tell us that the call has gone wrong. Stop-loss is an essential risk control mechanism; it should always be there.
- Book, at least, part profits when the prices reach their targets; if you continue to hold on to positions then use trailing stops to lock in your profits.
Follow on Facebook during Market Hours: https://www.facebook.com/pages/Brameshs-Tech/140117182685863
Please also read the detailed Disclaimer mentioned in the Right side of Blog.
Sir,
Positional call for above 3 shares?
I avoid giving positional calls in Expiry week.