


This is in continuation of the article “Impact of Institutional Investments on NIFTY” published last week. Data and suggestions compelled me to analyses further with FII trading as focus area. Will analyzing the mystery of FII alone throw clues in finding our way in market maze? What will you think, if you take a closer look at the pie chart below :

The above chart is based on average of daily turnover in NSE since April 2012 to Feb 2015.
Still not convinced to read further? Then take this. Majority of You, me and the other animals (bulls, bears…) who contribute to the second major share of daily turnover, trade against the big boys. Now, does it sound familiar read with the market gospel that 10% of traders gain what 90% lose? No exaggeration. The data shows existence of a very, very strong relationship between FIIs and the “Others” and the relationship is in OPPOSITE direction. This is deciphered by subjecting the daily trading data of the two segments to statistical analysis of correlation coefficient. It threw a correlation coefficient of -0.97 (negative) existing between the two. (Please refer to last week’s cited article to refresh your memory of this statistical tool). If the data is plotted to create a cluster chart, it creates the below chart.
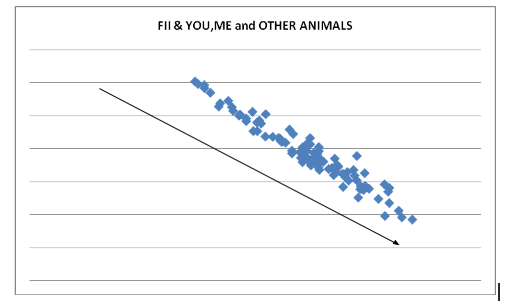
FII turn over in X Axis and Others on Y, show that on majority times/trades, majority of You and Me trade against the FIIs – one reason for the busted trading accounts that we have missed so long? Why else the market savvy traders keep highlighting on what FIIs did yesterday? Let me be honest. This research and analysis is an eye opener for me. Read further and decide for yourself.
FIIs take position in Index Futures, Stock Futures and Equities (called cash segment). Average of the past three years net turnover in each of these segments is produced in the below pie chart.

The above chart says that FIIs are predominantly Equity players, who dangle with Index and stock futures for short term trading. Two points must be emphasized about the above chart:
- It represents “average net position” at EOM. Not the turnover.
- The negative 10 (-10)% of stock future trading requires further study, which we will undertake.

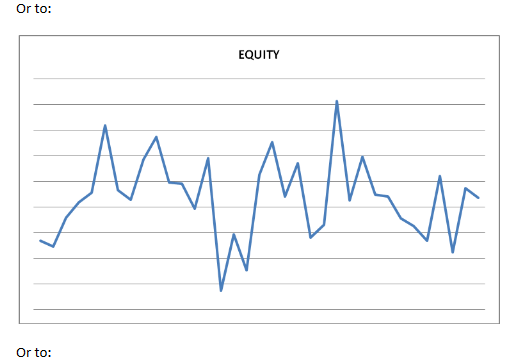
This take away was observed in the present analysis. A graphic representation of FII activity in the three segments over the study period is given below:

Do you see more green cones than the blue and red? Do you see blue and green cones in same direction? Do you also see the red cones in the opposite of green and blue cones? Let us dissect the chart further.

Are the stock future cones go in opposite direction of index futures? See next chat.
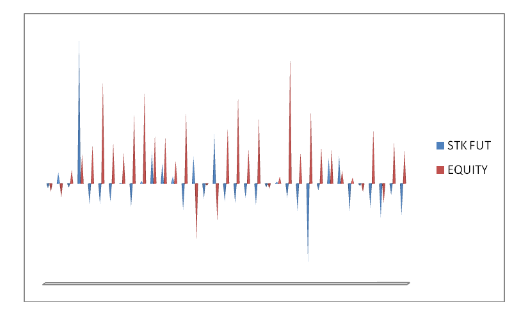
Is the above statement applicable to stock futures and Equity?
If so, what happens between equity and index futures? Here it is.
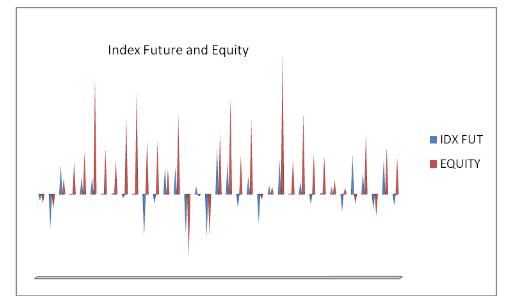
Above chart shows that equity and index futures are synchronized in their movement. Equity longs/exits are supplemented by longs/shorts in index futures. Further, above three charts also tell us that stock futures are mainly hedging tools and not necessarily trading instruments for the FIIs.
We will move on to understand the impact of FII activity in the three segments (Index & stock futures and equity) on market – NIFTY. A line chart of NIFTY during the study period is given below: (all data points are eom net numbers).
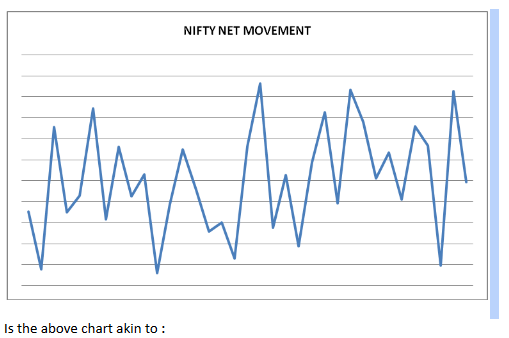


Take a closer look. NIFTY movement is more in sync with FII’s equity net position and absolutely mirrors FII’s Index future net position. Stock futures and NIFTY…what do you conclude? And also, stock futures and equity/index futures?
We will proceed with statistical analysis of the data before firming up our conclusion. Karl Pearson’s coefficient of correlation is used to understand the relationship between the three elements of FII trading and between them (Index & stock futures and Equity) and NIFTY. Produced below is a table of correlation values.

Above statistically determined values suggest that:
- Negative relationship between Index and stock futures, stock futures and equity.
- Positive relationship between equity and index futures.
- Positive relationship between Equity and NIFTY (0.56) (reduced marginally if clubbed with stock futures).
- Strong positive relationship between Index futures and NIFTY.(0.79).
As explained earlier, positive relationship suggests that NIFTY moves along with equity and index futures. NIFTY moves in the opposite direction of stock futures. And among the three segments, stock futures remain in the opposite direction of equity and index futures, meaning FII remain “short” in stock futures against their longs in equity and index futures and vice versa.
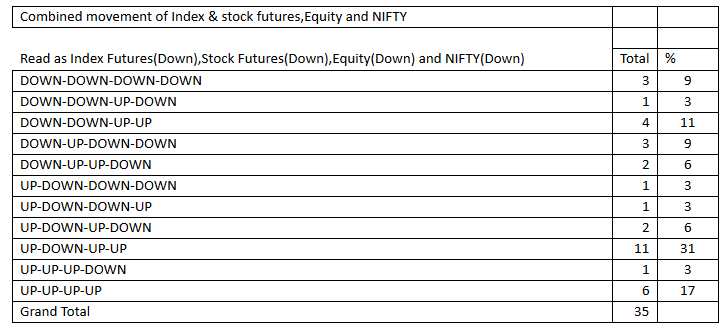
Movement of the FII trading components and NIFTY over 35 month period of study was tabulated to infer non tool based conclusions. The table is produced below.
| Combined movement of Index & stock futures,Equity and NIFTY | ||
| Read as Index Fututers(Down),Stock Futures(Down),Equity(Down) and NIFTY(Down) | Total | % |
| DOWN-DOWN-DOWN-DOWN | 3 | 9 |
| DOWN-DOWN-UP-DOWN | 1 | 3 |
| DOWN-DOWN-UP-UP | 4 | 11 |
| DOWN-UP-DOWN-DOWN | 3 | 9 |
| DOWN-UP-UP-DOWN | 2 | 6 |
| UP-DOWN-DOWN-DOWN | 1 | 3 |
| UP-DOWN-DOWN-UP | 1 | 3 |
| UP-DOWN-UP-DOWN | 2 | 6 |
| UP-DOWN-UP-UP | 11 | 31 |
| UP-UP-UP-DOWN | 1 | 3 |
| UP-UP-UP-UP | 6 | 17 |
| Grand Total | 35 | |
| Index Futures Down(Short) – NIFTY Down – 9 out of 13 times | 69.2 | |
| Index Futures Up(Long) – NIFTY UP – 18 out of 22 times | 81.8 | |
| Stock Futures were Down(Short) – NIFTY Down – 7 our of 7 times | ignored | |
| (But for 4 of the 7 times, the other two segments – Index Futures and Equity were also Down). | ||
| Only in two of the 35 month period NIFTY was down with Shorts in Stock Futures,when the other | ||
| two segments were UP. (i.e. Longs in Index Future and Equity,Short in Stock futures). | ||
| Stock Futures were Up(Long) – NIFTY UP – 6 out of 12 times | ignored | |
| (But during all 6 times, both Index Futures and Equity were Up). | ||
| Equity was Down (Net Sell) and NIFTY was Down – 7 out of 7 times. | ignored | |
| (But for 6 times, Index Futures was also Down and in 3 all three segments Down). | ||
| Equity was Up(Net Buy) and NIFTY was Up – 21 out of 27 times. | 77.8 | |
| (This is overcoming negative Index Futures – 4 times and negative stock Futures 21 times) | ||
Hence, graphically, statistically and through pure data analysis it can be concluded that :
- FIIs have remained long term buyers in equity and equity trading is their main focus.
- Index futures are the preferred trading tool
- Index futures are traded in the direction of equity position rather than against it
- Stock futures are used as hedging tool and normally FII position in them remain against their position in Index futures and equity.
- FIIs position in Index future influences NIFTY movement the most, followed by their position in equity.
- Large part of the retail/other segment (non FII/DII) trade in the opposite direction of the FIIs. (difficult to digest? Prove me wrong).
You can if you are a serious trader:
- Create a data sheet of daily FII activity in the three segments
- Watch out for drastic shifts in equity and Index futures
- Keep a close watch on the Stock future to Equity/Index ratio – an increase from normal denote FII’s “discomfort”.
Whatever you do….

Acknowledgements :
- Money control.com and NSE site for FII/DII data.
- Just Nifty blog Sri Vanilango for the NIFTY data.
@kindergardentrader/Bramesh Sir,
Just want to appreciate your benevolent effort . Thank you.
Regards,
ALL OUR EYES SPOILED WE MAY WORK SHIP SUN- NOW REVENGE POLITICS START WE ARE COATS LOT OF WOLFS READY TO START EAT OUR MONEY AND LIVES ABOVE 10 TRADING DAYS FII’S START IN SELL MOVE EXAMPLE IN HEROMOTOCORP, JUST DIAL, BHEL, AND LOT OF PSU STOCKS MID CAP FALL STARTS SEE SMALL CAP ALL FALL SOON
Hats off !!! Excellent article and research – kudos to those involved!!!!
we keep hearing that the market is at 24-25 PE and is say the market is overbought, also another set of people say that the PE is around 17-18 which is not so drastic, request to please share your expertise on this along with the levels which you analysed so beautifully.
this in my view will give a complimentary view of statistics with supports.
Thankyou !
Rgds,
Partha
One small query.
What is the impact of Options trading volume (Index & Stock), in comparison to Futures & Cash segment ?
Daily Turnover of options trading is almost 8-9 times more than cash+futures turnover
The most important point missed, the Others are not ‘LOSERS’ as mentioned above. You have to take the fact m-cap has increased by more than 3 times. I am pretty much sure Others portfolio gains should be better than FII’s. We need to look for such data.
Point noted. Does it mean “others” hold mid caps? In “over valued” large caps scenario, where does the savvy FII go to accumulate? It is unfortunately true that market movement and Others turnover increase are in opposite directions. I will be delighted if proved wrong. Thank you for the comment.
I am just taking example which may not give true picture without data but this surely throws some valid point. Take the example of PC Jeweller, FII got interested in stock around 260. The stock has rallied approx 2-3 times in last year and I believe most of Retail and others have left the counter for FII now. FII must have burned their finger in Gitanjali Gems, their holdings were more than Others. One more such counter was MCX when FII sold upto their heart content and stock nosedive upto 1/5 of value and Others only bought that counter and it has bounced approx 5 times from its low in last one year. So I believe Others may have left the counter for FII with handsome profit. Next such counter is Reliance Industries where they are reducing their holdings with downfall in price. During next upmove others will again leave the counter with initial uptrend for further gains fo FII. I will work further to get more data info and share with you.
Mr Manish – point valid and noted again. Kindly consider these two premises of the study 1. Majority times FIIs are winners 2. Majority times Others are losers. The aberrations observed may fall under minority times of the above. As simple business men traders, our focus is to make money. Don’t want to be the hero fighting the Goliath. Thank you again. I am sure as you expand the scope of your study with an open mind, our paths will merge. All the best.
amazing study rg sir,
its an eye opener for those who don’t use fii data in their analysis.
Eye opener. Amazing simple facts . Made more simpler by easy explanation. Congratulations for the effort in article. I understood from article to follow the system in efficient way. And not to become others. I know it is well said than done. But the directions for improvement can be thought from this amazing article. Hats off to you , sir.
SUPERB……………..AN EYE OPENER……………I HOPE FII’S ARE NOT READING THIS ARTICLE…………..
Dear Kindergardentrader….and my dearest Bramesh guruji….Thanks a lot for putting so much effort and sharing the knowledge with us..we all are grateful to you for enlightining us with the knowledge that u have acquired over som many years..You sahre FII fig DII fig and whenever doji or reversal is seen u are the first person who share it with group….I have also been analysing this data from many months…..I dont know whether u have considered participant wise data in this analysis…as far as market knowledge is concerned….i came to know that there are 4 players FII, DII …Client and Pro……….Everyone know FII DII and their positions….but if u will see pro’s position (retailers) and Clients position is never shown to us or it is not discussed..It is client + DII whose postion is opposite to FII….pro’s postion is compartive negligible as compared to these 3 players…..So i am still try to find out how these ppl must be playing but i am damn sure these 3 ppl must be playing in concensus…..might be aaj main khata hu kaal tu kha……but not sure..still working on the same.
Regards
shailesh
Mr Shailesh – “Others” category is all those traders client,pro,you,me) who are neither FII nor DII. The categories cited by you are considered under “Others”. It is the daily market turnover split between FII,DII & non(FII+DII). Keep working on your data. I don’t accept that there is no holy grail. It is just not yet been found. Thank you for the time.
thanks to you……for analysis range is very good ……..click to your all level ……
great analysis sir
how next level for nifty…?
The only word come in my mind is MASTER PIECE AETICLE. I am sure such skill cant come without long experience n dedication towards trading. We all thankfull that we get this knowledge at beginner level. This will definately enhance our trading skill n way of looking market in shorter n longer term.
Thanks a lot..
Brameshji,
Firstly, Really food for thought. Many thnx
Going a step forwards on analysis, i wonder how and WHY the opposite category (“Others”) does exist! Are they there merely because of hope? (“Oh! tomorrow will definitely be our day!”)
Go with the trend…oops, sorry, FII
Thanks to Kindergardentrader for doing such a detailed analysis and enlightening all the blog readers.
Rgds,
Bramesh
Natvision – If they don’t exist, then who will supply the profits? The emphasis of this article is to request the readers to vow not to join the “third front”.(no politics intended).
Thnx for your comment. Appreciate the reason for which the analysis of the data and the conclusion is done. My question was merely looking at the physiological angle.
Thnx again. Look forward to thought provoking analysis
Great Research and Thanks for enlightening to us.
Regard
very nice and truly said thanks for info
Thanks. This is a great article. Rarely do we see statistical analysis of historical data, I will keep this as reference.
Sir this is great. Thanks A Lot it really benefit for future trading. Great Great Great.
Good analysis.based on this where you see nifty and bank nifty for expiry this month.
Mr Prem Soni – for FIIs day-to-day trading is like tilling their field. They are not bothered about intra-day profit or expiry game. The bottom line is to know whether their fundamental outlook for short term changes.
Thanks for taking so much of pain for analysing data ,its very useful for gainful trading
Really an excellent article bramesh.Now my doubts are cleared that I asked you 2 days back.Although FIIs and DIIs data shows positive, market has been falling for last few days.There are other bigger players in d market
Mr Gopal – “There are other bigger players in d market” – yes and they trade against FII (as per data). It fits the logic too. If FIIs have to buy, someone must SELL to them? Unfortunately, this “bigger players” are the major LOSERS. So please don’t join them.