


Voltas

Any close above 290 stock is heading to 300/310/322.
Intraday Traders can use the below mentioned levels
Buy above 290 Tgt 295,298 and 302 SL 288
Sell below 286 Tgt 284,282 and 280 SL 288
Havells
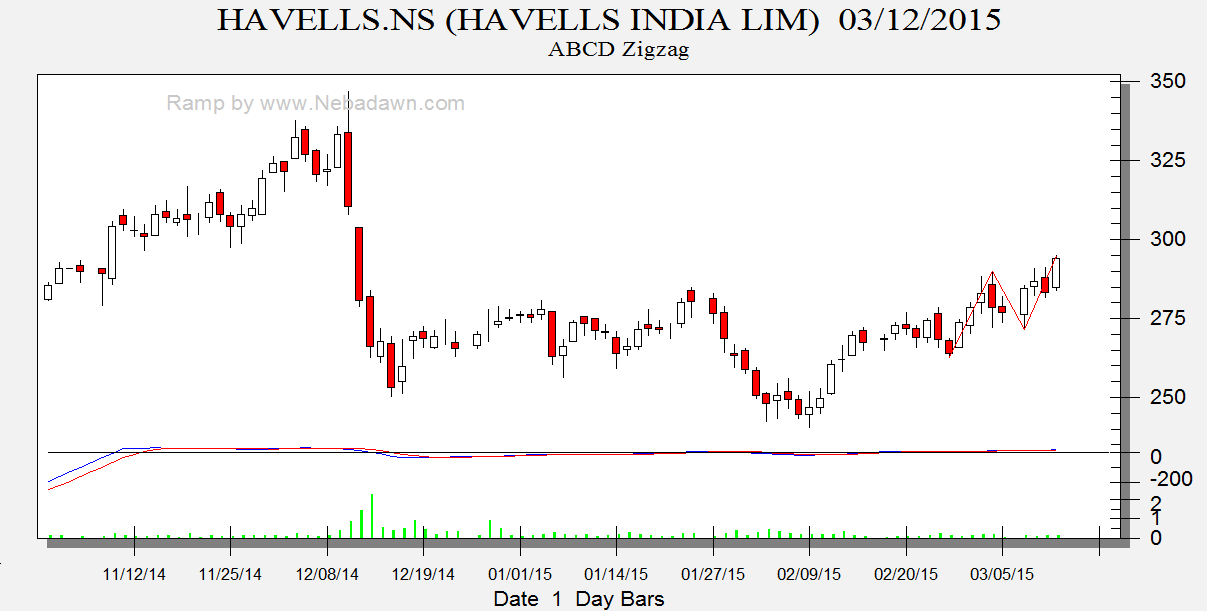
Any close above 296 stock is heading to 305/322.
Intraday Traders can use the below mentioned levels
Buy above 295 Tgt 298,302 and 305 SL 293
Sell below 290 Tgt 287,283 and 280 SL 292
AuroPharma
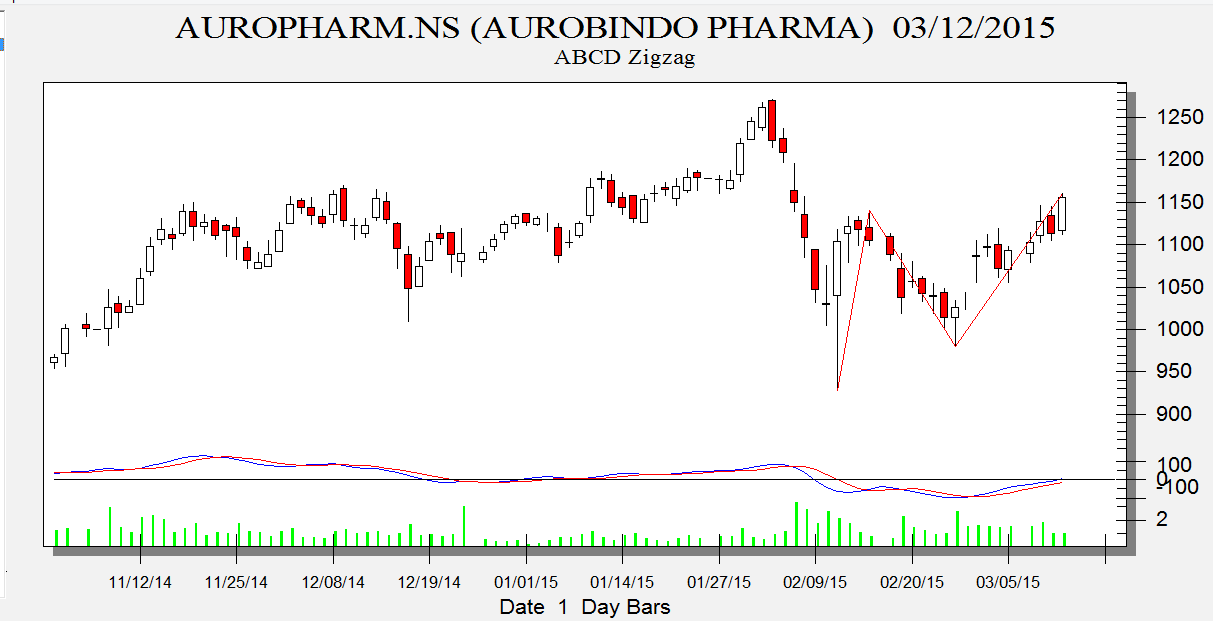
Intraday Traders can use the below mentioned levels
Buy above 1160 Tgt 1173,1191 and 1223 SL 1155
Sell below 1140 Tgt 1131,1124 and 1111 SL 1145
How to trade Intraday and Positional Stocks Analysis — Click on this link
Performance sheet for Intraday and Positional is updated for February Month, Intraday Profit of 2.81 Lakh and Positional Profit of 3.74 Lakh
http://tradingsystemperformance.blogspot.in/
http://stockpositionaltrading.blogspot.in/
- All prices relate to the NSE Spot/Cash Market
- Calls are based on the previous trading day’s price activity.
- Intraday call is valid for the next trading session only unless otherwise mentioned.
- Stop-loss levels are given so that there is a level below/above, which the market will tell us that the call has gone wrong. Stop-loss is an essential risk control mechanism; it should always be there.
- Book, at least, part profits when the prices reach their targets; if you continue to hold on to positions then use trailing stops to lock in your profits.
Follow on Facebook during Market Hours: https://www.facebook.com/pages/Brameshs-Tech/140117182685863
Please also read the detailed Disclaimer mentioned in the Right side of Blog.
The post given here are My Personal views and for learning purpose, trading or investing in stocks is a high risk activity. Any action you choose to take in the markets is totally your own responsibility. I will not be liable for any, direct or indirect, consequential or incidental damages or loss arising out of the use of this information.