


Last week we gave Chopad Levels of 8416 Nifty triggered SL on upside and than rewarded discipline traders with 202 points. Lets analyze how to trade Nifty in coming week.
Nifty Hourly Chart

Nifty Hourly charts moved between both support and resistance line in previous week and is trading above its 21/34 HEMA.8231/8242 is the support zone holding the same nifty can move towards 8400/8450 levels.
Nifty Hourly Elliot Wave Chart
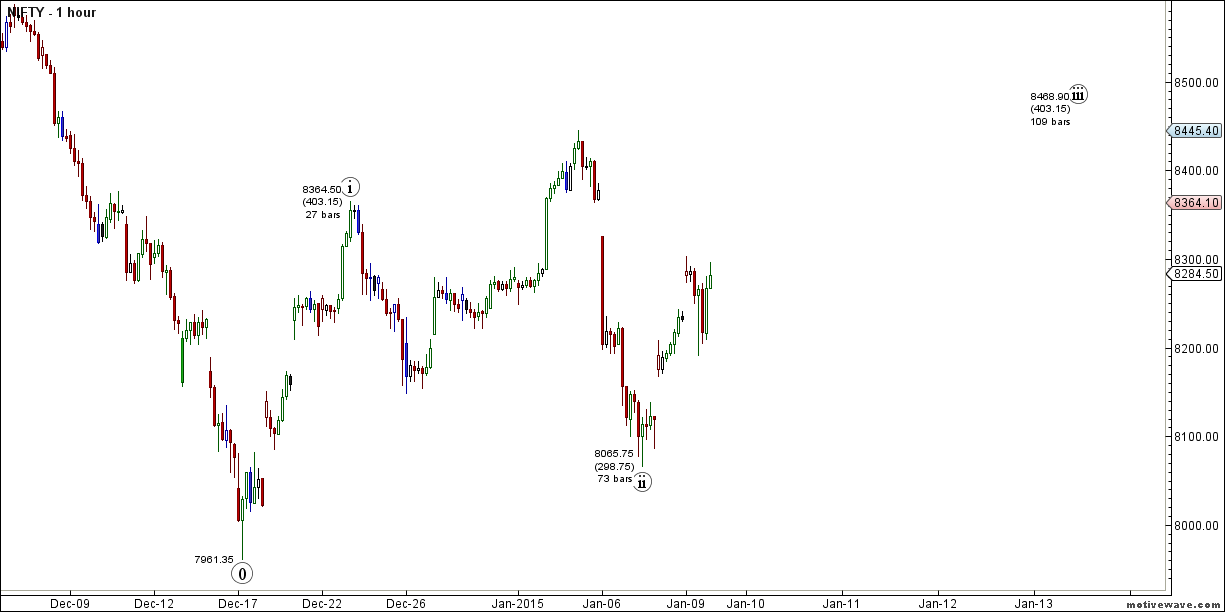
Elliot wave chart on Hourly is shown above suggesting upmove can continue further and 8480/8550 will decide further course of action.
Nifty Daily Chart

Nifty daily chart has completed 56 trading days from the low formed on 17-Oct, as per gann theory next week will be very crucial as per time theory, Also Nifty for 3 time has taken support near 100 DMA also forming triangle formation with breakout, breakdown offing in coming week.
Nifty Harmonic Pattern

As per Butterfly harmonic pattern nifty is heading towards new high by Feb holding 7961.
Nifty Daily Elliot Wave Chart

As per EW more legs are left to the rally use dips to take exposure to quality large and mid caps stocks.
Nifty Gann Date
Nifty As per time analysis 12 Jan is Gann Turn date , except a impulsive around this date. Last week we gave 06 Jan and Nifty give the biggest fall in the current bull market.
Nifty Gann Emblem

16 Jan are very important date as per Gann Embelm.
Nifty Gaps
For Nifty traders who follow gap trading there are 7 trade gaps in the range of 7000-7800
- 7067-7014
- 7130-7121
- 7276-7293
- 7229-7239
- 7454-7459
- 7526-7532
- 7598-7568
- 7625-7654
- 7780-7856
- 7927-7974
- 8029-8065
- 8378-8327
- 8102-8167
Fibonacci technique
Fibonacci fan

Nifty took exact support @ gann fan and now entering the resistance zone in range of 8420/8440
Fibonacci Retracement

8294 is 50% retracement closing above it 8372 which is golden ratio needs to be watched closely.
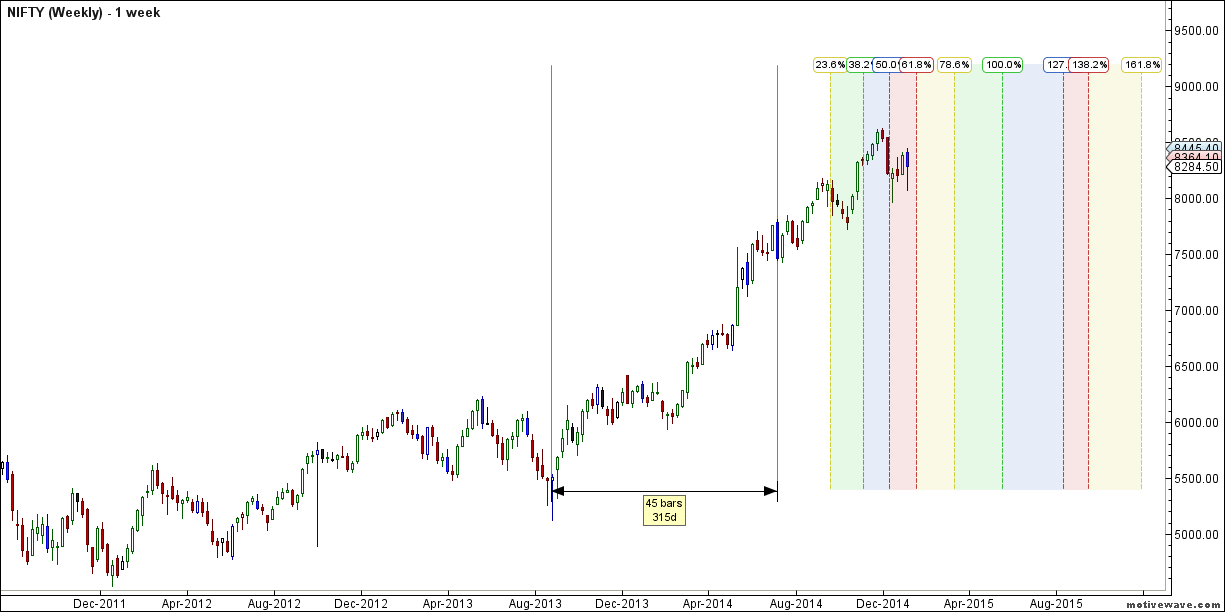
Nifty Weekly Chart

It was negative week, with the Nifty down by 110 points closing @8284 and trading in its uptrending channel . Weekly time frame as per Harmonic suggests Nifty is still in buy on dips mode .
Trading Monthly charts

Uptrending Monthly channel is still on, so new highs can still come.
Nifty Weekly Chopad Levels
Nifty Trend Deciding Level:8286
Nifty Resistance:8335,8367,8445
Nifty Support:8237,8180,8140
Levels mentioned are Nifty Spot
Let me go by Disclaimer these are my personal views and trade taken on these observation should be traded with strict Sl.Please also read the detailed Disclaimer mentioned in the Right side of Blog.
Want to see post in your Inbox,Register by adding your email id in Post in your Inbox section
Follow on Facebook during Market Hours: https://www.facebook.com/pages/Brameshs-Tech/140117182685863
Dear brahmesh….You have not replied to my questions.
Thank you sir
Hi,
Gann date’s have always been rewarding. Can you mention these dates in advance, say for the next 15 day’s or so. Will be quite helpful
I cover the same in my trading course.
dear bramesh i dont understand nifty chopad levels,can u pl put it in simple terms like buy/sell at this point and keep sl at this point or reverse at this point?thanx
Its clearly mentioned
Rgds,
Bramesh
I see doji candle on daily chart….isn’t it can be trend reversal sign?….kindly give your opinion.
Dear Audhesh ,
I do not think so.
Rgds,
Bramesh
Always wait for weekly report
Is a gann date a negative day only. WhatWhat is a exact meaning of gann date. Can you share record data for gann dates? I have observed that most of the times it was red day on nifty when it comes to gann date.
Please go through my earlier reports and do your research.
Rgds,
Bramesh
Dear Sir
Great post as usual. Wish to trade as per the levels and am sure it will be very rewarding.
Ashok.