


Last week we gave Chopad Levels of 8806 Nifty did 2 target on upside. We saw a roller coaster ride in last week with Bulls were on front foot till Thursday and Friday was the day Bears came back strongly, So have we formed short term top or start of new correction. RBI policy next week on 3 Feb will keep traders alert. Lets see how to trade nifty in coming week.
Nifty Hourly Chart
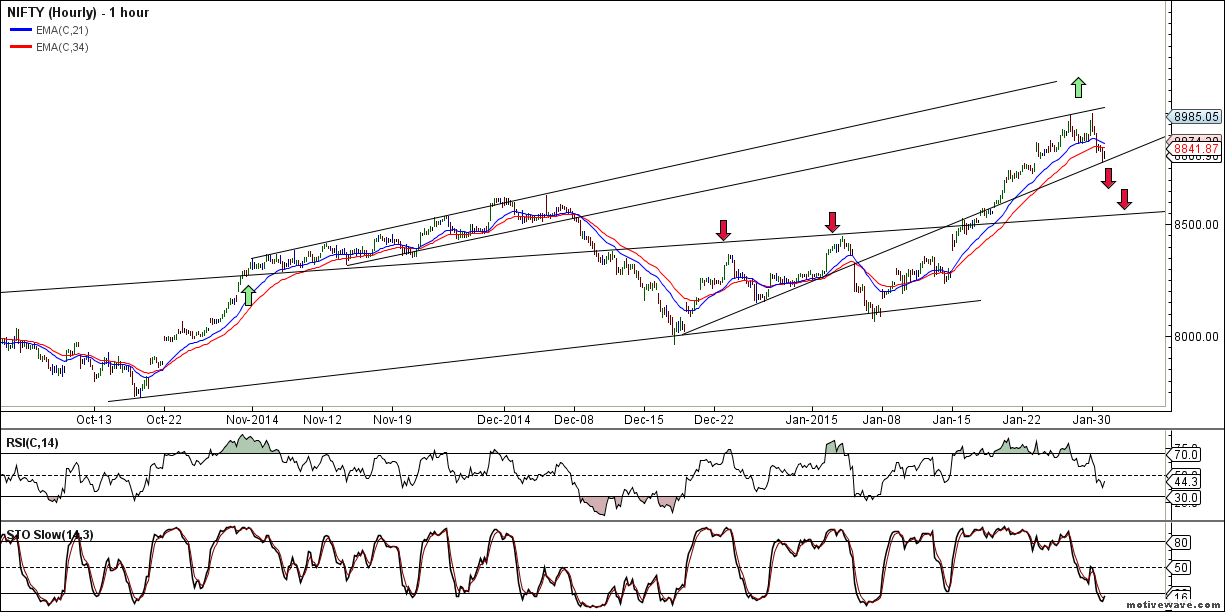
Nifty Hourly charts has broken its both 21/34 HEMA as nifty was unable to cross its trendline resistance, Now nifty is at crucial support of 8774/8754 , breaking the same correction can run deep, able to hold another attempt will me made for new highs.
Nifty Hourly Elliot Wave Chart

Elliot wave chart on Hourly is shown above suggesting correction can resume if 8754 is broken and closed below it. Holding 8754 can see move back towards 8900.
Nifty Daily Chart
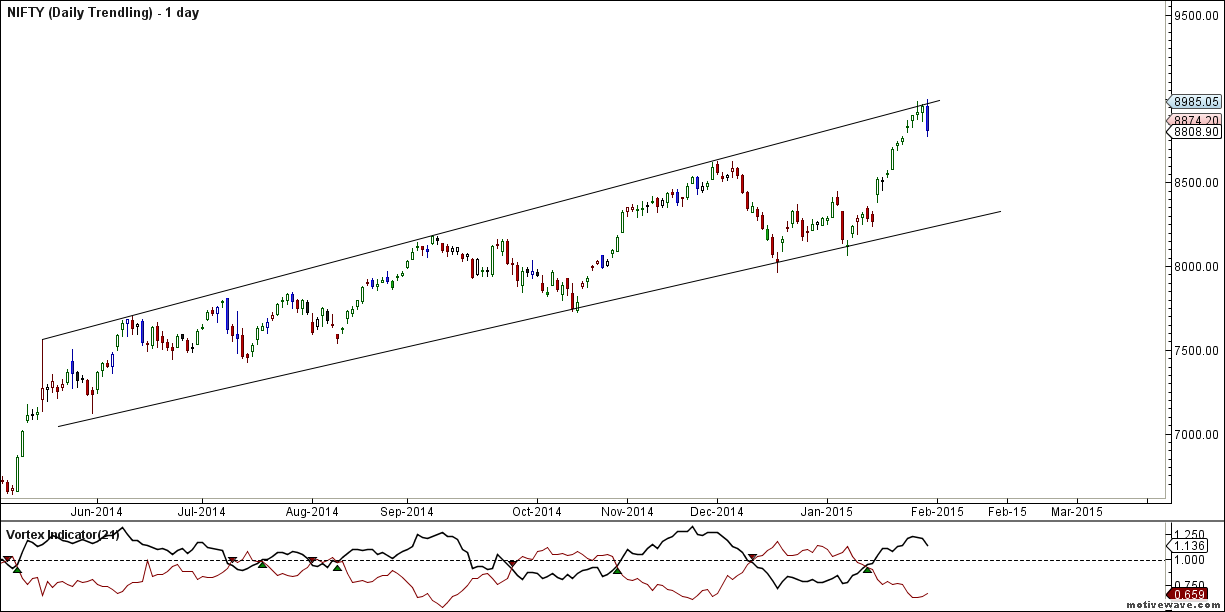
Nifty has reacted last Friday from its long term resistance line as seen in past occasion nifty will try to touch its lower end of trendline which comes around 8350/8300 odd levels.
Nifty Harmonic Pattern
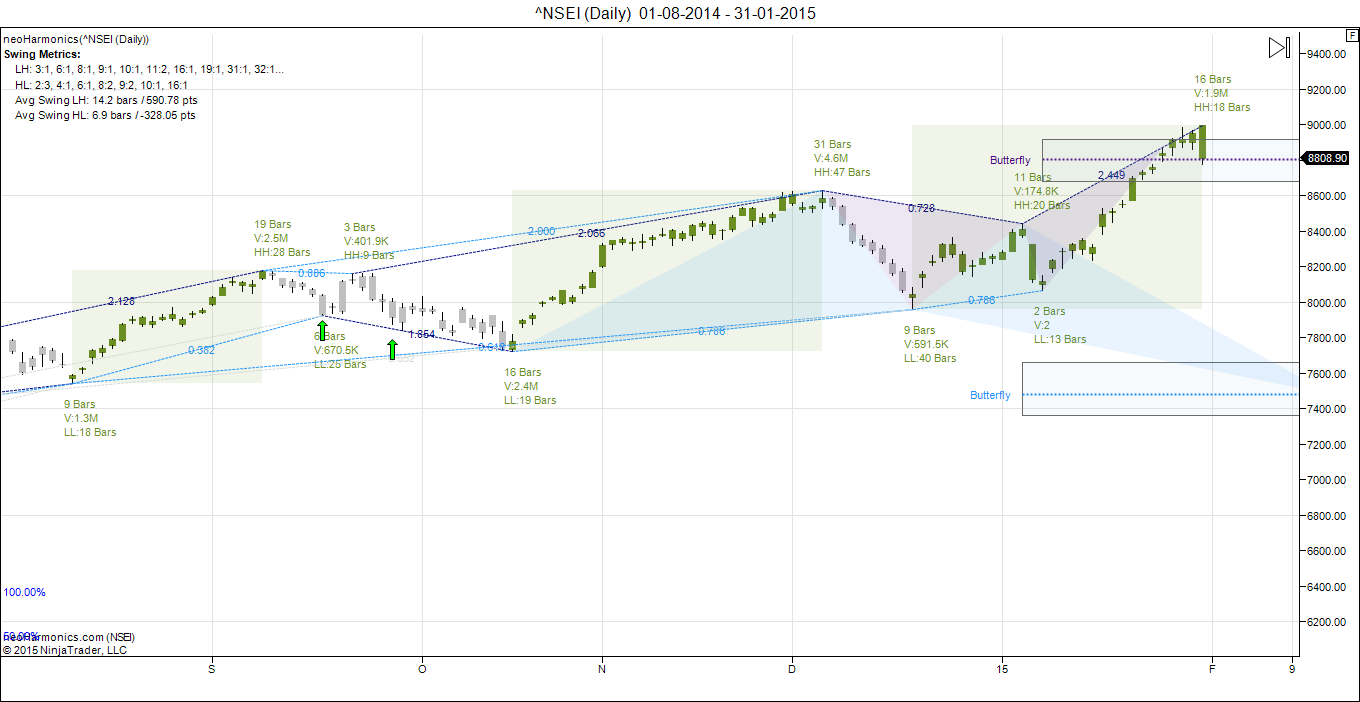
As discussed in last analysis market oblized us.
Nifty Daily Elliot Wave Chart

As per EW more legs are left to the rally use dips around 8300/8400 to take exposure to quality large and mid caps stocks.
Nifty Gann Date
Nifty As per time analysis 02 Feb +1 day is Gann Turn date , except a impulsive around this date. Last week we gave 28 Jan +-1 Day and Nifty formed short term top on that day only forewarning of correction. As per gann theory Feb 5 needs to be closely watched apart from turn date.
Nifty Gann Emblem

16 Jan are very important date as per Gann Emblem. RBI news came 1 day before the gann emblem date Next important day to keep in mind is 16 Feb.
Nifty Gaps
For Nifty traders who follow gap trading there are 7 trade gaps in the range of 7000-7800
- 7067-7014
- 7130-7121
- 7276-7293
- 7229-7239
- 7454-7459
- 7526-7532
- 7598-7568
- 7625-7654
- 7780-7856
- 7927-7974
- 8029-8065
- 8378-8327
- 8102-8167
- 8277-8380
- 8513-8531
- 8550-8574
- 8761-8774
Fibonacci technique
Fibonacci fan

Nifty took exact resistance @ gann fan and is now going towards lower end. As per Fibo retracement theory Nifty took support at 23.6% retracement @ 8776 unable to hold heading towards 8641/8531 odd levels as shown below.

Nifty Weekly Chart

It was negative week, with the Nifty down by 26 points closing @8808 forming a gravestone doji pattern, correcting after touching the upper trendline resistance. As discussed in last analysis Weekly time cycle also started in positive note, its time to be cautious now as Nifty is approaching its trendline resistance in daily, weekly and monthly charts so book some profit in nifty and stocks positions.

Trading Monthly charts
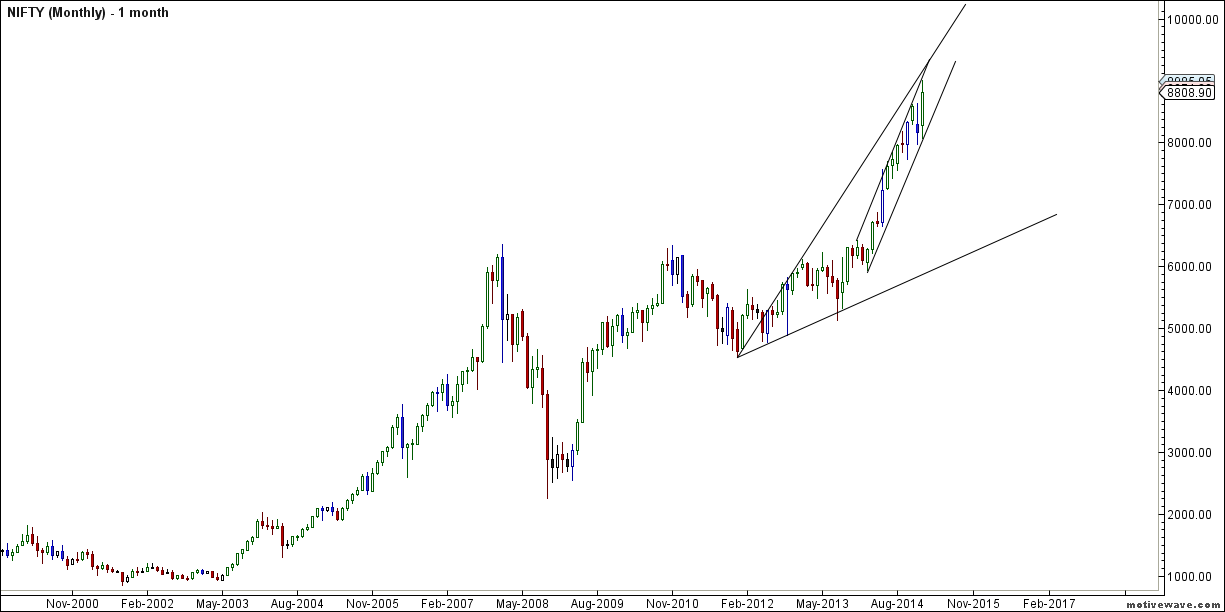
Nifty reacted from its upper trendline of Monthly channel we can see dip till 8300/8350 odd levels.
Nifty Weekly Chopad Levels
Nifty Trend Deciding Level:8806
Nifty Resistance:8888,8957,9079
Nifty Support:8723,8680,8600
Levels mentioned are Nifty Spot
Let me go by Disclaimer these are my personal views and trade taken on these observation should be traded with strict Sl.Please also read the detailed Disclaimer mentioned in the Right side of Blog.
Want to see post in your Inbox,Register by adding your email id in Post in your Inbox section
Follow on Facebook during Market Hours: https://www.facebook.com/pages/Brameshs-Tech/140117182685863
Hi Bamesh,
Missed your FII analysis and Stock levels….Hope you are doing well…..
Thanks for sharing knowledge…
Query: Nifty closing below 8806 means taking short positions? Trend changes to downwards?
Regards,
Sachin
Was bit busy with my training and seminars.
Yes your understanding is correct.
Bramesh ji, Your analysis and guidance is giving us confidence to trade accurately. Your Gann Dates have been spot-on. Please accept our grateful thanks. Your free advice will give you bountiful returns. Thank-you.
Thanks a lot !!
Rgds,
Bramesh
market will turn bearish look only if it closes below 8337 levels,,,may i right bramesh sir
It’s very far for traders 100 point move can change views.
Nice analysis
why FII data is missing
any problem in NSE website
please keep updating data
both FII and DII
Sir but nifty did close 3 times above 8888. How do we interpret that
Please follow the levels mentioned. It gave 100 points on close above 8888 and now below it corrective trend starts.
Rgds,
Bramesh