


Last week we gave Nifty Chopad level of 8355 Nifty we expected correction but market continued its upward journey and moved up 50 points not a major move. Lets analyze how to trade nifty next week.
Nifty Hourly Chart

Nifty Hourly charts has meet its trendline resistance @ 8411 unable to cross and break of 21 HEMA @8303 will see a quick fall till 8280 levels , Breaking the same can see deeper cut else bounceback again on cards till 8465/8500 levels.
Nifty Daily Chart

Nifty daily chart is also has formed a series of DOJI’s and double top pattern @ 8411 also trendline resistance as per above chart with negative divergence visible in daily indicators. 8365 will play an important resistance strong support @ 8200.
Nifty Harmonic

Nifty as per harmonic pattern seems to have covered maximum move of this current rise, We see maximum rise of 650 in upmove we have done 700 +points in 19 trading session so upmove will come to an end, Also as show in above chart Nifty has reached the top end of grey box upside and bias has turned neutral with a grey bar we can see decline of 200/300 points in nifty by 27 November. Do not use this to buy Puts blindly.
Nifty Daily Elliot Wave Chart
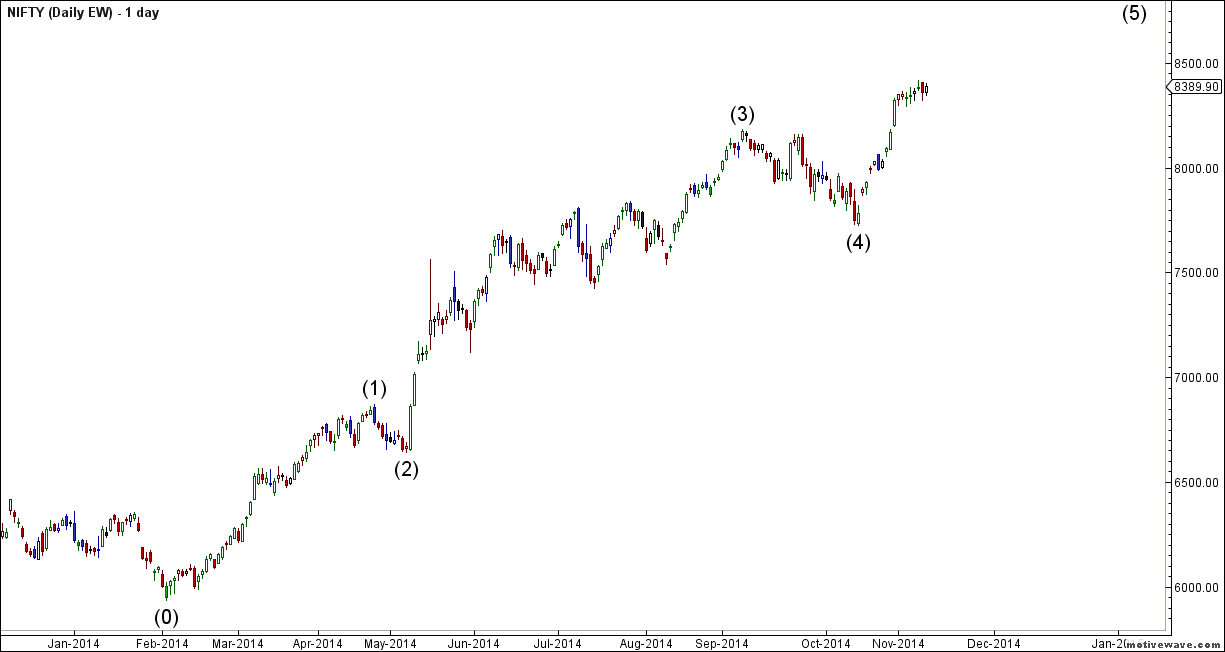
Daily chart are is showing 4 wave completed @7723 and V wave has started target comes @ 8660, correction will be part of the rise so use dips till 8000/8169 to enter.
Nifty Gann Date
As per time analysis 19 November is Gann Turn date , except a impulsive around this date. Last week we gave 11 November is Gann Turn date but Nifty did not show expected move.
Nifty Gaps
For Nifty traders who follow gap trading there are 7 trade gaps in the range of 7000-7800
- 7067-7014
- 7130-7121
- 7276-7293
- 7229-7239
- 7454-7459
- 7526-7532
- 7598-7568
- 7625-7654
- 7780-7856
- 7927-7974
- 8027-8052
- 8169-8198
Fibonacci technique
Fibonacci fan

8120/8044 should be watched closely when we see pullback in NIfty
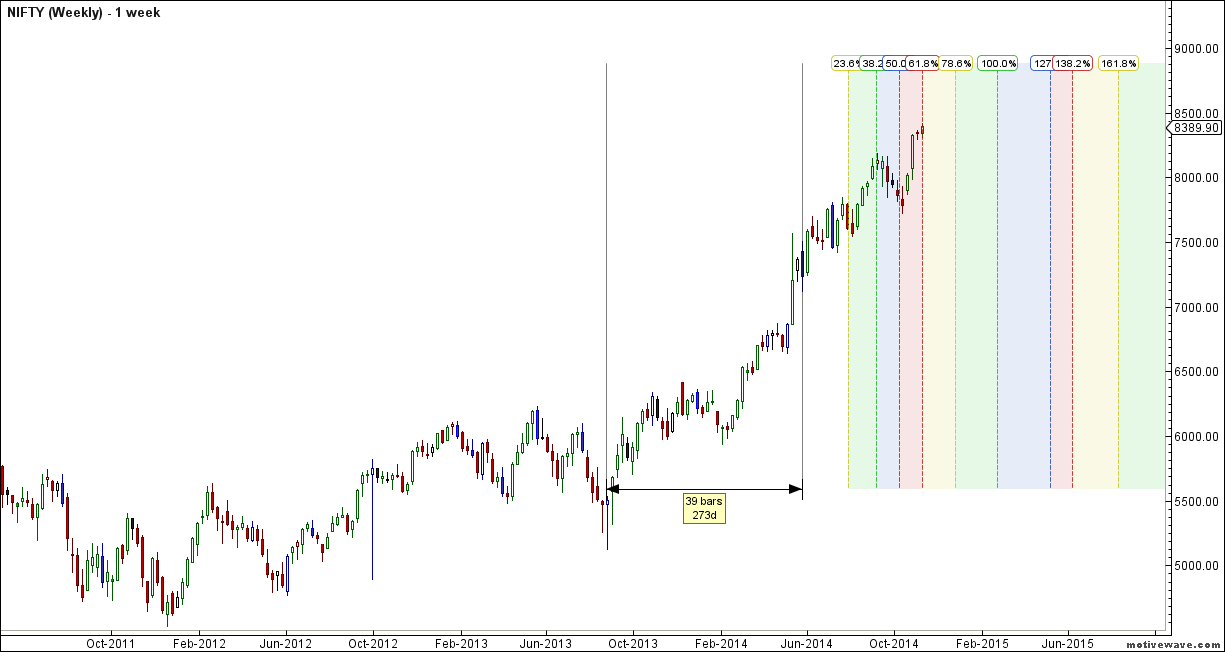
Nifty Weekly Chart

It was positive week, with the Nifty up by 52 points closing @8390 forming a DOJI candlestick pattern on Weekly charts. Next week will be very crucial and can start a short term correction. As per Harmonic Weekly chart nifty has reached the grey box upper end on weekly chart also so time to be cautious as we can see sideways/bearish move with a negative bias in coming 2 weeks.
Trading Monthly charts

Bulls need to protect the recent low of 7723 for rest of days for bullish moves to continue.
Nifty Weekly Chopad Levels
Nifty Trend Deciding Level:8416
Nifty Resistance:8465,8500,8550
Nifty Support:8367,8286,8237
Levels mentioned are Nifty Spot
Let me go by Disclaimer these are my personal views and trade taken on these observation should be traded with strict Sl
Want to see post in your Inbox,Register by adding your email id in Post in your Inbox section
Follow on Facebook during Market Hours: https://www.facebook.com/pages/Brameshs-Tech/140117182685863
pls. Answer, Trend Deciding level and Trend Changer level prices of nifty future, are included with premium + nifty spot price, or only SPOT price. (spot+premium) or (spot only)
Thank you sir.
Sir,
Your analysis is unparallel. Even a novice like me can operate.
Bramesh Sir,
Thankyou for the detailed analysis.
TDL @ 8416 and R1 also 8416 is this correct. please clarify
Thank you