


Last Week we gave Chopad level of 7636, Nifty did 2 target on upside and downside target was met with a gao down. Resurfacing of Geopolitical risk is making bulls jittery but nifty is also near important support levels keeping both bulls and bears on tenterhook Lets analyze how to trade Nifty in holiday shortened week.
Nifty Hourly Chart

Nifty Hourly charts shows have been trading in a channel, now currently trading near the channel bottom which is around 7540 , any break below it the current uptrend can come to an end, Holding the same we can see 7700-7750 again.
Nifty Elliot Wave Analysis

Nifty is currently in its 3 wave in hourly charts, short term target comes @ 7509, Nifty made low of 7540 on Friday, Break below 7540 we can see 7510-7500 levels. Only close below 7500 further downside is expected till 7422 else we can bounce till 7700.
Nifty Daily Chart
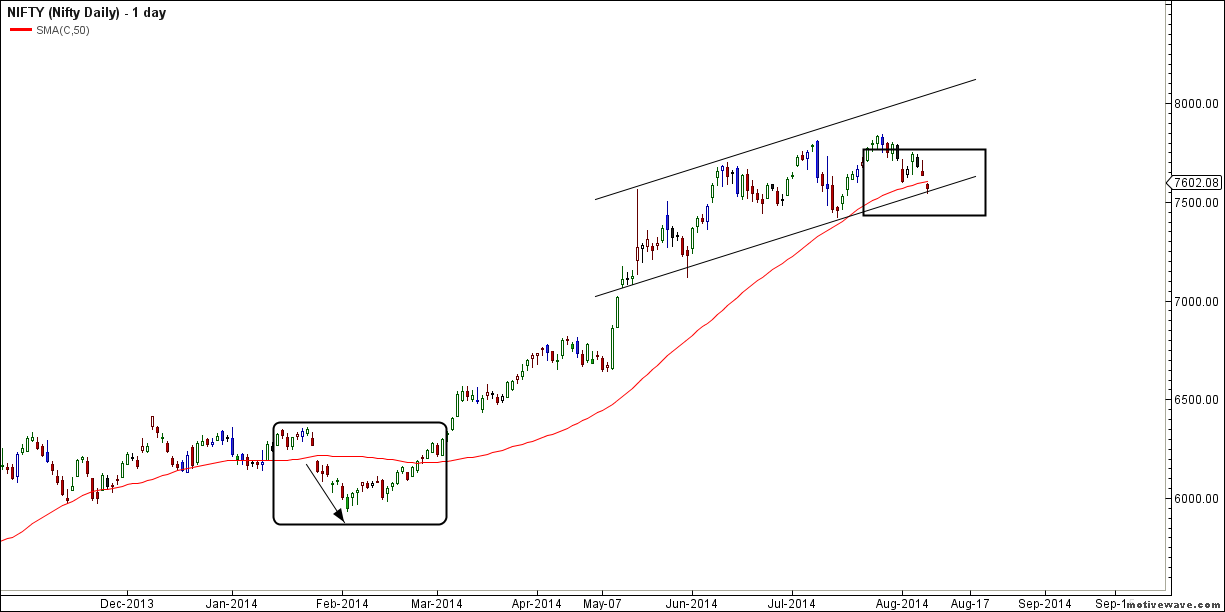
Here is an Interesting observation on Daily chart Last time NS broke its 50 SMA was on 27-Jan with a gap down and corrected almost 255 points or 5% to make major low @ 5933 in 7 trading session and started the big rally till 7836 Today also NS broke its 50 SMA with a gap down Will History Repeat ?
Nifty Daily Elliot Wave Chart

Daily chart are still trading in 3 Wave and dips till 7422 needs to be bought into.
Nifty Gann Date

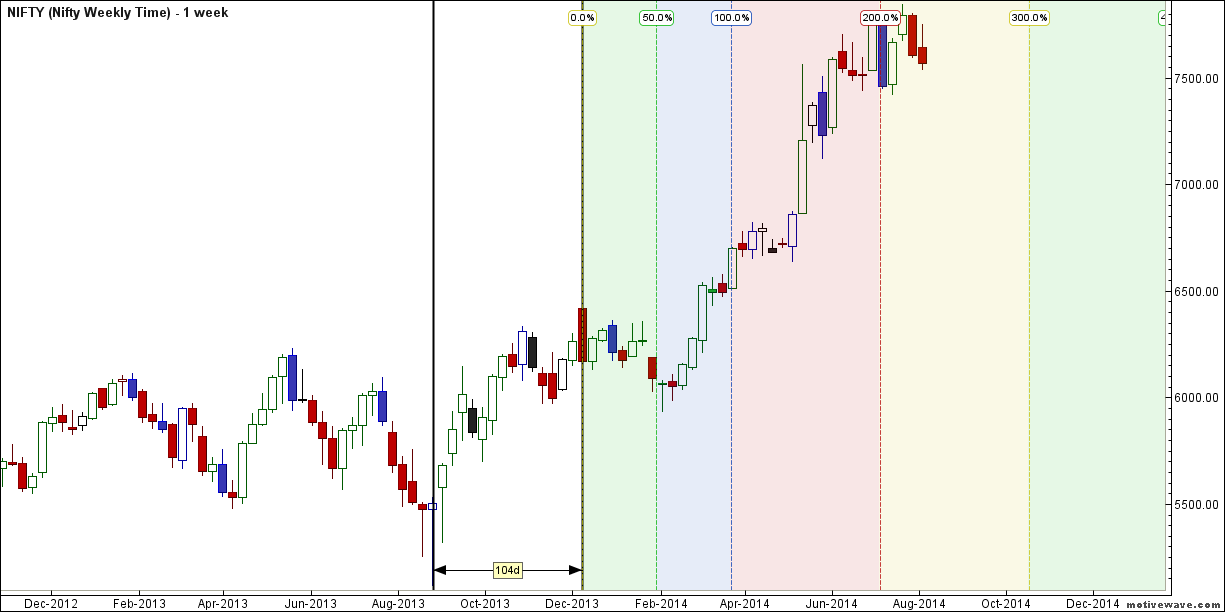
14 Aug +/- 1 days is gann turn date and explosive move is round the corner. Last week we gave date of 05 Aug +-1 date and we saw explosive upmove on 05 Aug
Nifty Gaps
For Nifty traders who follow gap trading there are 7 trade gaps in the range of 7000-7800
- 7067-7014
- 7130-7121
- 7276-7293
- 7229-7239
- 7454-7459
- 7526-7532
- 7592-7649
Fibonacci technique
Fibonacci fan

NIfty took exact support at Gann Circle will it bounce this time like last time ?
Nifty Fibo Retracement

7557 which is 23.6 and 7382 which is 50% retracement should be watched closely in coming week.
Nifty Weekly Chart
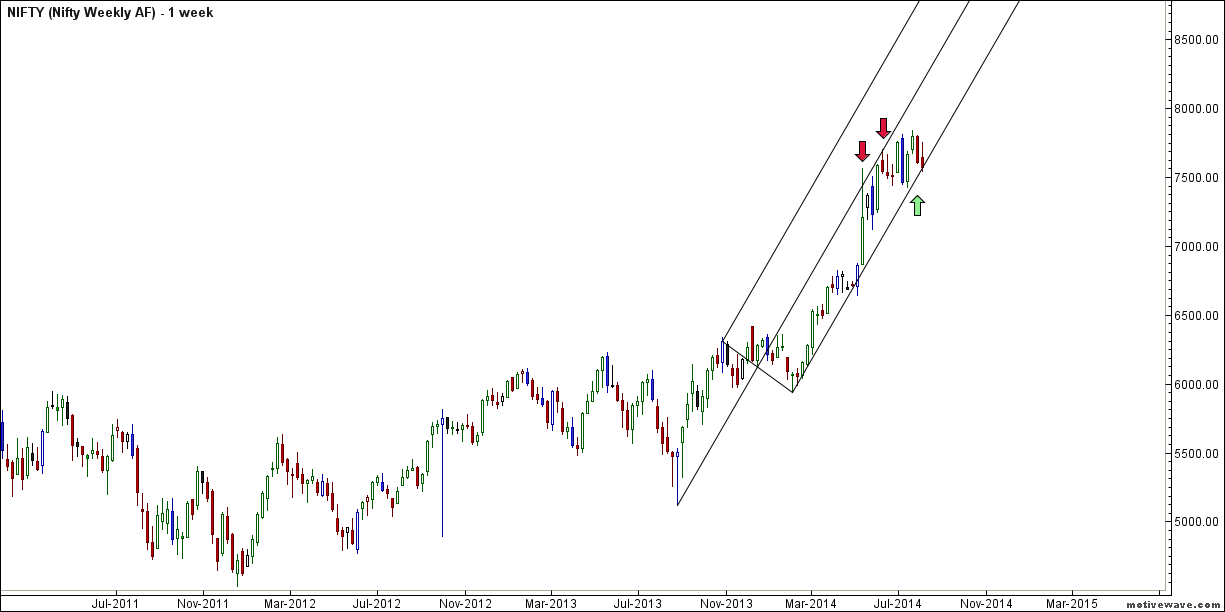
It was negative week, with the Nifty down by 34 points closing @7568. Now Nifty is near its Andrew Pitchfork support line and Holding the same bounceback can start. For 9 weeks Weekly Charts are trading in a range of 7422-7808. So a big move is round the corner.
Trading Monthly charts

Bulls will have to save 7422 for momentum to build in August Month as July Series formed a spinning top pattern.
Nifty Weekly Chopad Levels
Nifty Trend Deciding Level:7620
Nifty Resistance:7685,7750,7840
Nifty Support:7500,7422, 7350
Levels mentioned are Nifty Spot
Let me go by Disclaimer these are my personal views and trade taken on these observation should be traded with strict Sl
Want to see post in your Inbox,Register by adding your email id in Post in your Inbox section
Follow on Facebook during Market Hours: https://www.facebook.com/pages/Brameshs-Tech/140117182685863
Hi Ramesh Ji. I would like to know how to trade the above levels during market. Thanks, Gopi
awesome brahmesh ji