


Ranbaxy
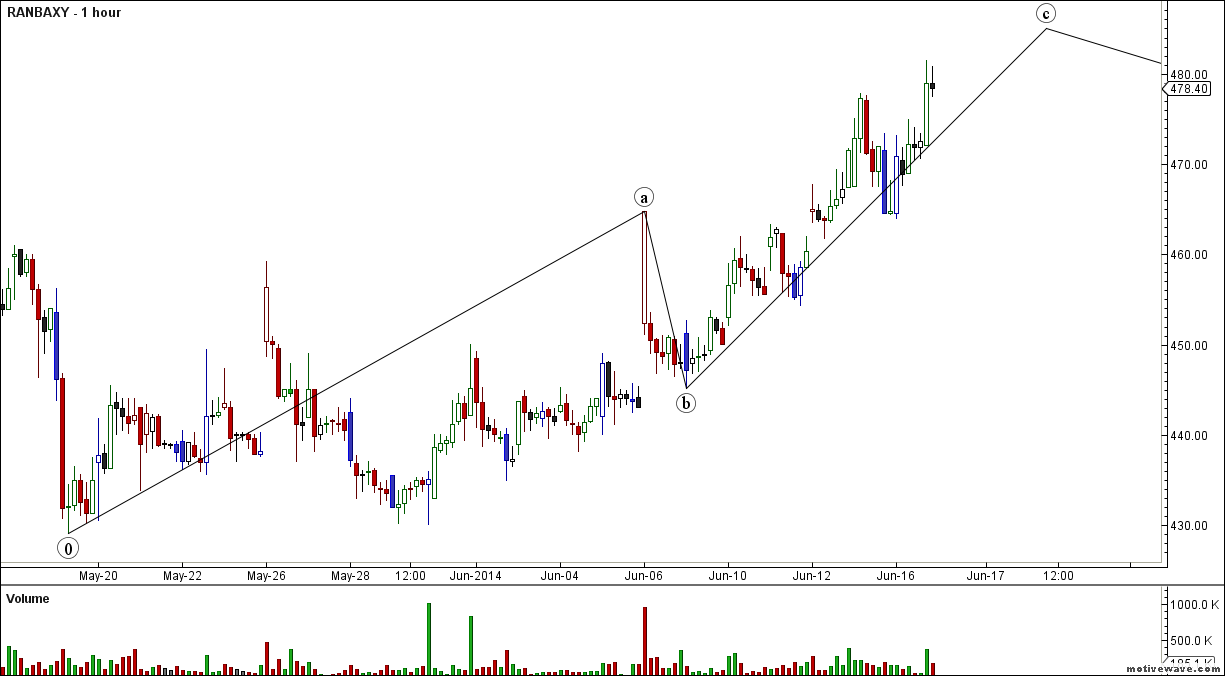
Buy above 481.5 Tgt 485,492 and 503 SL 479
Sell below 474 Tgt 468,464 and 458 SL 479
Reliance

Any close above 1076 stock is heading towards 1100.
Buy above 1069 Tgt 1076,1085 and 1095 SL 1065
Sell below 1053 Tgt 1042,1033 and 1027 SL 1057
BHEL

Any close above 242 stock is heading towards 254.
Buy above 242 Tgt 244.5,248 and 254 SL 240
Sell below 238 Tgt 235,232 and 229 SL 240
Performance sheet for Intraday and Positional is updated for May Month
http://tradingsystemperformance.blogspot.in/
http://positionalcallsperformance.blogspot.in/
- All prices relate to the NSE Spot
- Calls are based on the previous trading day’s price activity.
- The call is valid for the next trading session only unless otherwise mentioned.
- Stop-loss levels are given so that there is a level below/above, which the market will tell us that the call has gone wrong. Stop-loss is an essential risk control mechanism; it should always be there.
- Book, at least, part profits when the prices reach their targets; if you continue to hold on to positions then use trailing stops to lock in your profits.
Bramesh bhai,
I bought Reliance Fut after seeing your analysis at 1063 Spot, it was not moving at all. I closed it @ 1074, it flew to a high of 1098.4 and spot 1090. excellent call. Thank you.
Thanks and Njoy !!
Rgds,
Bramesh
Dear Bramesh,
I have been watching your website for the calls like today Ranbaxy,Reliance and BHEL .
I just want to know how do you come out with the Buy /Sell levels.
Is it based on Fibonacci retracement using previous day high low close or
simply EW 3rd wave or 5th wave levels along with Alternate possibilities to go in other direction .
Can you pls let me know
Thanks
Anand
Dear Anand,
It based on my trading system we generate levels.
Rgds,
Bramesh