


Rupee breached the psychological mark of 60 per dollar,Rupee has rebounded 15%. In the January-March quarter alone, the rupee has gained 3.6%, making it the second best performer in the region. Lets analyze rupee move in coming week as we have crucial RBI policy.
USD INR Hourly

INR is trading at the lower end of channel in 4 hourly chart, signalling a pullback can be seen back to 60.3-60.5 range in coming week.
USD INR Daily

USD INR chart is now entering the crucial demand zone of 59.2-59.8 suggesting a bounceback can be seen, Medium term target of Rupee comes at 56.9-57.5 as per fibo channel as shown in above chart.
USD INR Weekly
 As per Weekly chart also Rupee is trading near the interaction of trendline, Traders carrying short should book out positions in range of 59.2-59.7 in coming week, Aggresive longs can also be taken near 59 odd levels for short term target of 60.2-60.5.
USD INR Monthly
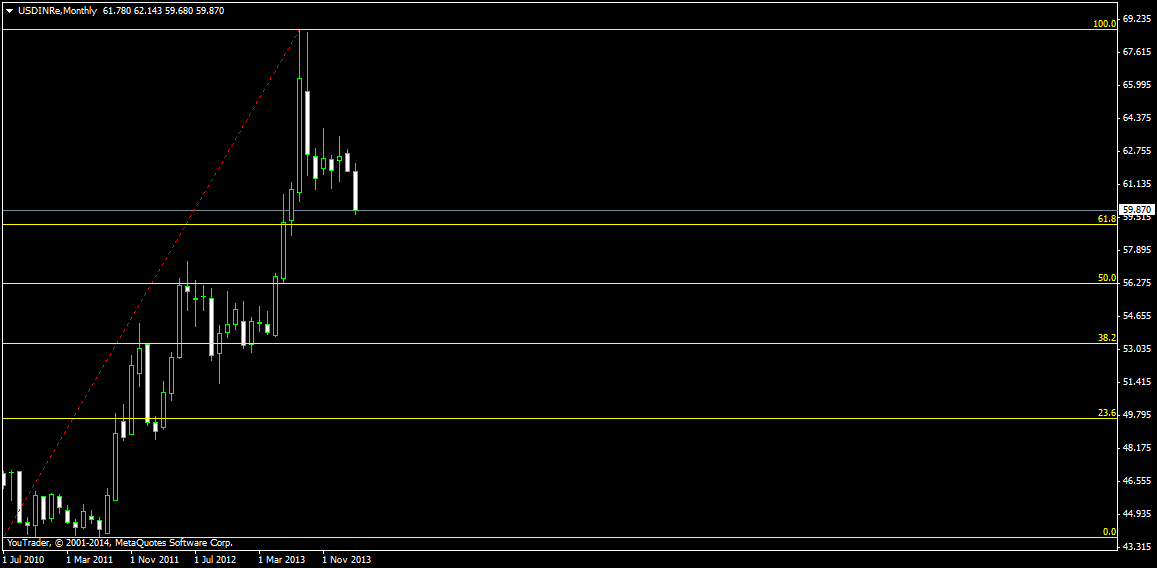 As per Monthly Chart Rupee is approaching the golden ratio at 59.2 which is again a strong support.
USD – INR Trend Deciding Level:60
USD – INR Resistance:60.70,61.30 and 62
USD – INR Support:59.51,58.88 and 57.90
Levels mentioned are USD – INR April Future
Follow on Facebook during Market Hours: http://www.facebook.com/pages/Brameshs-Tech/140117182685863