


Last week we gave Trend Deciding level as 5785 Nifty Nifty achieved 2 weekly target on upside and 1 weekly target on downside so traders were able to capture both upside and downside move :).
September 2013 corporate earnings will start with Infosys reports Q2 results on Friday, 11 October 2013. IIP data will also be declared after market hours on 11 Oct. Political developments in the United States will be closely watched as a partial government shutdown is still in effect.
Lets analyze how to trade Nifty next week.
Nifty Hourly Chart

Nifty Hourly charts is forming a symmetrical triangle,Breakout above 5950 and breakdown below 5898
Nifty Gaps
For Nifty traders who follow gap trading there are 3 trade gaps in the range of 5300-6000 and all other gaps got filled.
- 5285-5303
- 5448-5553
- 5680-5700
- 6012-5989
Nifty Daily Chart Time Analysis
Nifty Daily chart we have applied the time analysis, BLUE Lines suggests either swing top and bottom of the Nifty, As seen in below chart Nifty formed a short term bottom as discussed last week .

Fibonacci technique

As per of Fibo Retracement theory Nifty has broken the resistance at 78.6% retracement with gap up, and is now acting as a classic support .Any close below 5924 nifty can fall back to 5806 odd levels.Nifty still unable to close above 5924
Fibonacci fan

Nifty Fibonacci fan are wonderful tool to find the top and bottom in short term.Still filtering around the fibo line and next week the mystery should get resolved.
Nifty Weekly Chart

Trading Monthly charts
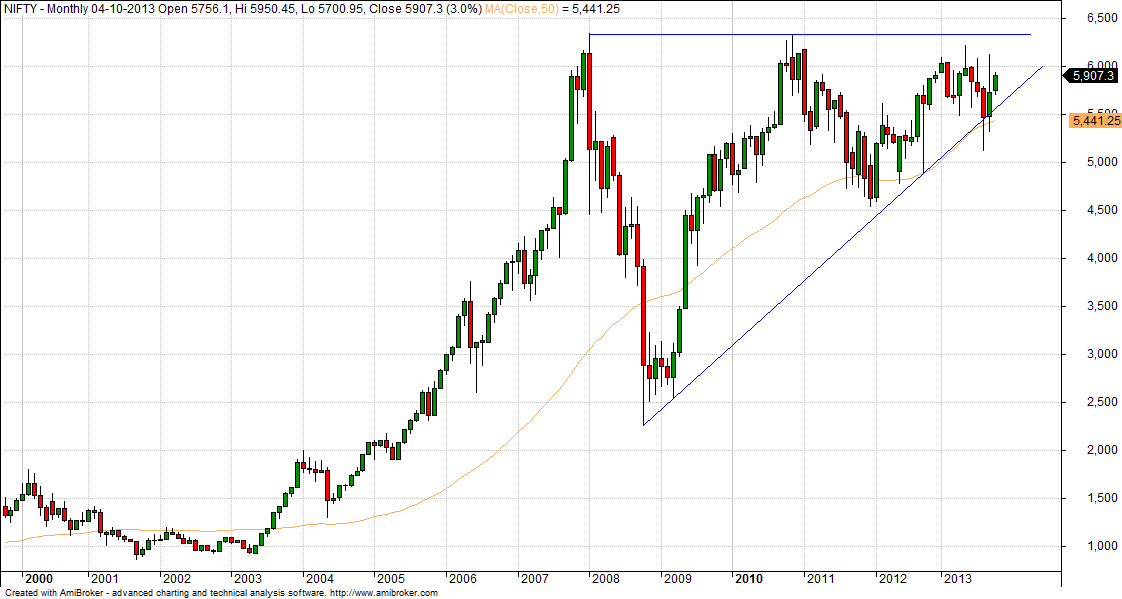
Looking at monthly chart I am expecting October to be a choppy month confusing market participants looking at previous price patterns.
Nifty Trading Levels
Nifty Trend Deciding Level:5946
Nifty Resistance:5990,6077 and 6142
Nifty Support:5898,5816 and 5768
Levels mentioned are Nifty Spot
Stock Performance Intraday sheet for Sep Month is updated on http://tradingsystemperformance.blogspot.com/
Stock Performance Positional sheet for Sep Month is updated on http://positionalcallsperformance.blogspot.com/
Let me go by Disclaimer these are my personal views and trade taken on these observation should be traded with strict Sl
Want to see post in your Inbox,Register by adding your email id in Post in your Inbox section
Follow on Facebook during Market Hours: https://www.facebook.com/pages/Brameshs-Tech/140117182685863