


- FIIs sold 20879 contracts of Index Future (added 25342 Contracts of Longs and 43221 fresh shorts were added) worth 581 cores with net Open Interest increasing by 71563 contracts. So as per data analysis, FII are still in shorts net to net basis.
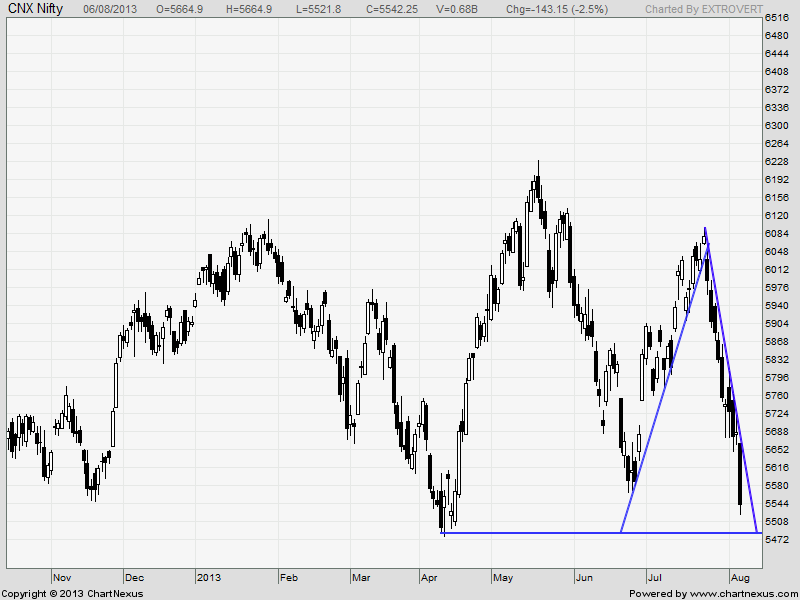
- It was black day for Indian markets as India markets out of trillion-dollar club market cap slips to $989 bn. Nifty broke 5550 and Sensex dipped below the psychological level of 19000. The story in mid cap stocks is heart wrenching as many of them are below 2008 low. Nifty last support remains in 2013 low of 5477 as seen in below chart. As discussed in Weekly analysis Nifty broke below 5686 and achieved all weekly targets in one day 🙂
- Nifty Future Aug Open Interest Volume is at 1.66 cores with addition of 14 lakhs in Open Interest, huge shorts entered into the system.
- Total Future & Option trading volume at 1.56 lakh with total contract traded at 3.2 lakh , PCR (Put to Call Ratio) at 0.95.VIX finally gave a breakout as is trading at 22.72. Higher VIX more volatility in market.

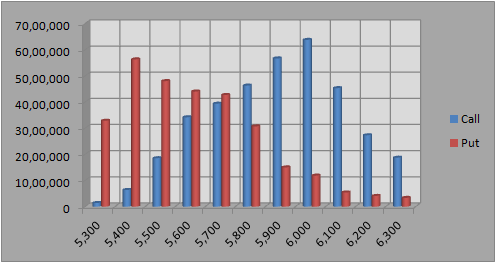
- 6000 Nifty CE is having highest OI at 63 lakhs with liquidation of 6.8 lakhs in OI, 5900 CE added 4.3 lakh in OI and having second highest OI at 56.7 lakh,5500 CE and 5600 CE adding 31 lakh in OI suggests 5500-5600 remains the new fighting ground . 5400-6000 CE added 46.8 lakh in OI.
- 5400 PE OI at 56 lakh remain the highest OI, with additionof 9 lakh in OI, 5500 PE added 10 lakh in OI, so short term support around 5500 odd levels.17 lakh got liquidated in 5700 PE as Put writers were caught on wrong foot. As per Options Data analysis, FII bought 67989 Put options. 5400-6000 PE liquidated 20 lakh in OI.
- FIIs bought in Equity in tune of 212 cores ,and DII sold 313 cores in cash segment ,INR closed at 60.8, after hitting record high. New RBI governor has positive effect on Rupee.USD INR Weekly Technical Analysis
- Nifty Futures Trend Deciding level is 5567 (For Intraday Traders).Nifty Trend Changer Level 5806 and Bank Nifty Trend Changer level 10275.
Buy above 5576 Tgt 5600,5620 and 5640(Nifty Spot Levels)
Sell below 5522 Tgt 5508,5488 and 5459(Nifty Spot Levels)
Live Nifty A/D charts Click on the Link
Traders who use Pivot and Camarilla can use the following 2 sites for Hourly values and EOD values
http://camarillapivotpoints.blogspot.com/
http://niftystockpivot.blogspot.in/
We do discussion in Live market to update Nifty levels If you are interested you can LIKE the page to get Real Time Updates.
Follow on Facebook during Market Hours: http://www.facebook.com/pages/Brameshs-Tech/140117182685863
One should read this, for stocks where FII are buying
Shareholding Analysis: Jun-13
In Jun-13 Quarter, FII holding in Indian Stock Market went up by 0.51% from 20.7% to 21.2%.
FIIs showed their strong confidence in ICICI Bank, Oracle Fin Services, Dr Reddy, DLF, NTPC and Adani ports, HDFC Bank, as their investment in these stocks was huge as compare to other stocks. They approximately invested Rs 8400 crores in these seven stocks.
(Refer Table for stocks where FII invested more than Rs 200 crores in Jun-13 quarter)
Key stocks, which FIIs considered for selling are Hind Unilever, TCS, Reliance Ind, Infosys, L&T, SBI and Tata motors. They approximately realized Rs 8700 crores from these seven stocks.
(Refer Table for stocks where FII sold for more than 200 crores in Jun-13 quarter)
Other stocks where FIIs showed positive interest are Havells India +5%, United Phosp +5.5%, Strides Acrolab +6.3%, Eicher Motors +3.1%, Astrazeneca Pharma +15.3%, Magma Fin corp +14.3%, Madras Cement 4.2%, Zee Learn +14.3%, PVR+3.5%
As a sector, Pharma was again FIIs favorite destination for investment. Their holding in the sector went up by 2.2%. Investment in this sector was broad-based, as their Advance/Decline Ration ( ratio for number of companies where they significantly increased the holding to companies where they significantly reduced the holding) was as high as 4:1. Following table shows the stocks where there was significant action.
Though in IT sector, their holding went down by 0.5%, but FIIs Holding Advance Decline ratio was 7:1. This is because, they reduce holding from giants of the sector viz TCS and Infosys, but increased holding in Midcap Companies. Are they more confident of Indian I.T. MidCap, as compare to I.T Large Cap ???
(Refer Table IT stocks where FII were more active – Chg more than 1%)
Media & Entertainment is another sector which, though a small sector but has seen considerable interest from FIIs in various companies.
(Refer Table Media, Ent. stocks where FII were more active – Chg more than 1%)
I read an article in TOI last week when the same incident happened during 2008 when Indian stock market was out of trillion dollar club for some time and had gained its position back again. But having said that what/where does India lack compared to other Asian countries say Hongkong, Japan or even China who are way ahead of 1 trillion and we are just inching around the 1trilling mark ?