


Mcleod Russel
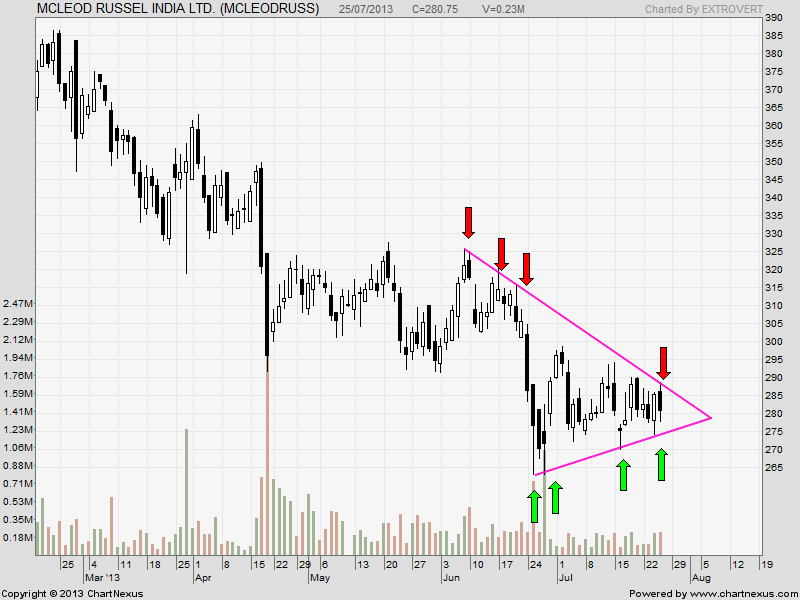
Mcleod Russel stock on daily chart is forming a perfect symmetrical triangle, Triangle breakout happens above 289 and breakdown below 275.So watch out for breakout/breakdown move. Positional target for breakout comes at 325 and breakdown comes at 254.
Buy above 283 Tgt 287,293 and 298 SL 280
Sell below 276 Tgt 271,266 and 260 SL 280
CESC

CESC stock on daily chart has closed below its 50 DMA for 2 day with formation of DOJI and Inside day candle stick pattern signalling an explosive move is round the corner.
Buy above 337 Tgt 340,343 and 348 SL 333
Sell below 329Tgt 325,322 and 314 SL 333
JSW Energy
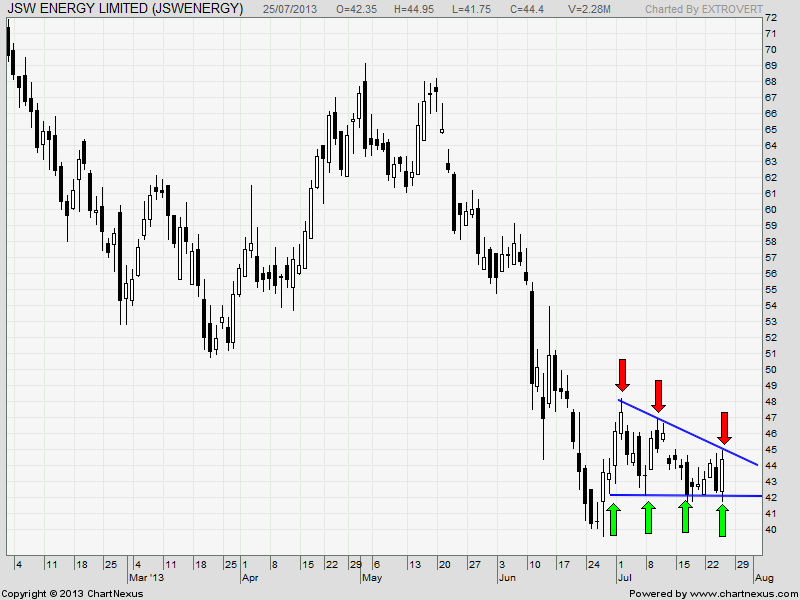
JSW Energy stock has been stuck in trading range forming multiple lows at 42 odd levels. Stock has formed a bullish engulfing pattern today, signalling follow up action in today’s trading day.Positional traders should look for a close above 50 for short term target of 55
Buy above 45.6 Tgt 47,48 and 50 SL 44.4
Sell below 43.5 Tgt 42.4,40 and 39 SL 44.4
Stock Performance Sheet for the Month of June is Updated @http://tradingsystemperformance.blogspot.in/ Net Profit for the month of July is 1.93 Lakh
- All prices relate to the NSE Spot
- Calls are based on the previous trading day’s price activity.
- The call is valid for the next trading session only unless otherwise mentioned.
- Stop-loss levels are given so that there is a level below/above, which the market will tell us that the call has gone wrong. Stop-loss is an essential risk control mechanism; it should always be there.
- Book, at least, part profits when the prices reach their targets; if you continue to hold on to positions then use trailing stops to lock in your profits.
We do discussion in Live market to update Nifty levels If you are interested you can LIKE the page to get Real Time Updates.