


Fears About Fed Tapering Have Sent Markets Into A Tail Spin and there are a financial rout around the globe. Equities,Bonds, Commodities and Currencies all went into tail spin. Bonds saw the biggest correction in 50 Years, Thats the kind of power is Held by US Fed Ben Bernanke. Indian market was not an exception to the widespread bloodbath and nifty fall down almost 2.9% and made a low around 5616 and finally settled at 5667.
Last week we gave Trend Deciding level as 5830 Nifty achieved 3 weekly targets on downside.
Nifty Hourly Chart
Nifty Hourly charts is taking resistance at 21 HSMA, and trading in perfect down trending channel.Range of 5550-5605 is very crucial range in Nifty as there are cluster of support in this range. Any pullback from this range will be sharp and swift.
Nifty Gaps
For Nifty traders who follow gap trading there are 1 trade gaps in the range of 5400-6000 and all other gaps got filled.
- 5878-5868
- 5822-5755
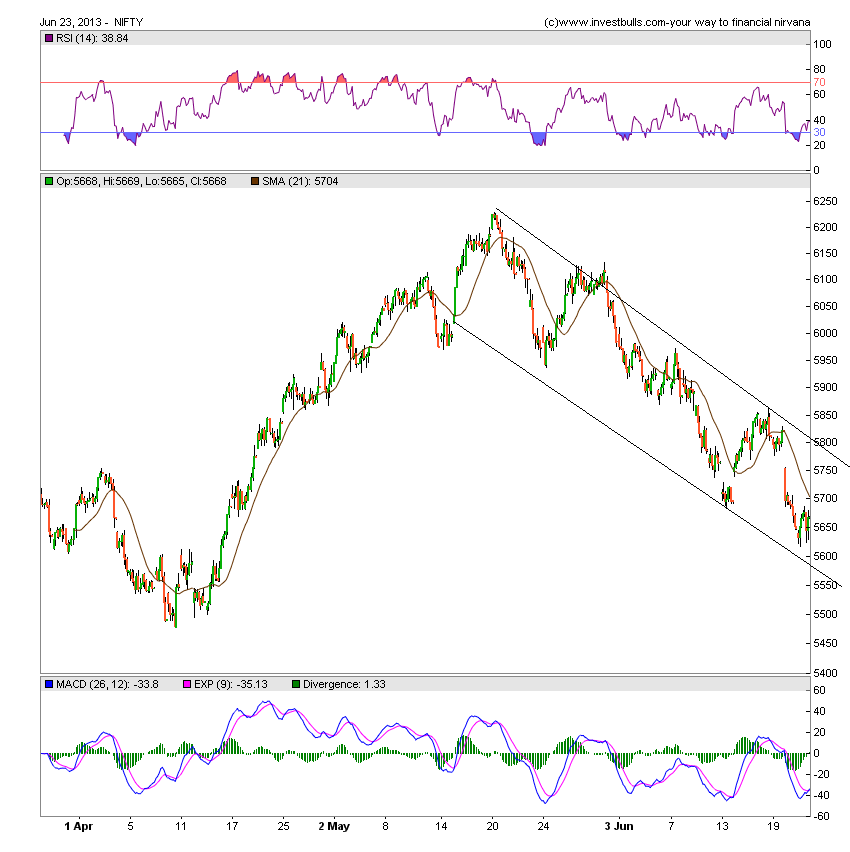
Nifty Daily Chart
On Daily chart closed below 200 DMA on weekly basis,and also near its trendline support of with rSI showing positive divergence, Holding 5617 for next 2 days can be seen as indication of pullback getting over and rally can be seen till 5764 odd levels.Nifty is constantly making lower highs and lower lows showing that the weakness persists.

Fibonacci technique

As per of Fibo Retracement theory Nifty took support at 5637 which is 80 % retracement from 5474-6229. Holding 5617 further bounces can be expected.
Fibonacci fan
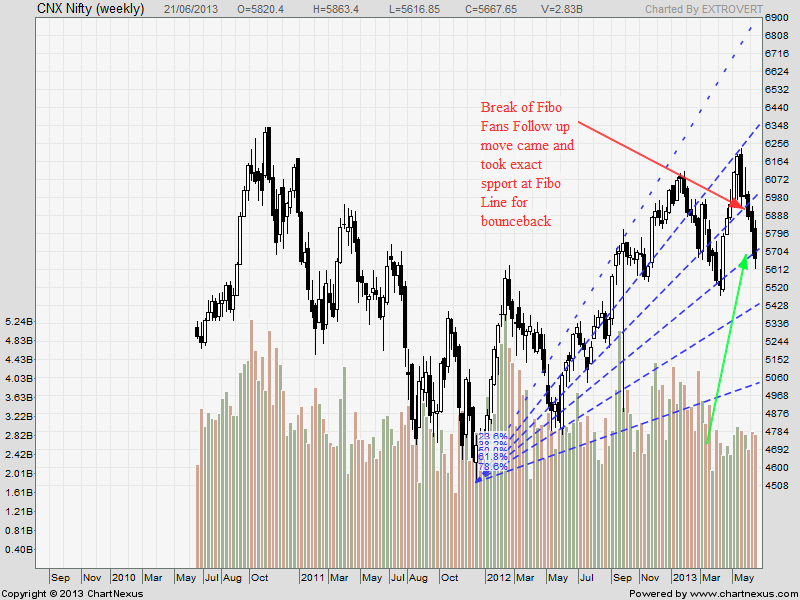
Nifty Fibonacci fan are wonderful tool to find the top and bottom in short term.Another week of consolidation around Fibo fans. Decisive move should come next week.
Nifty Weekly Chart

Trading Monthly charts
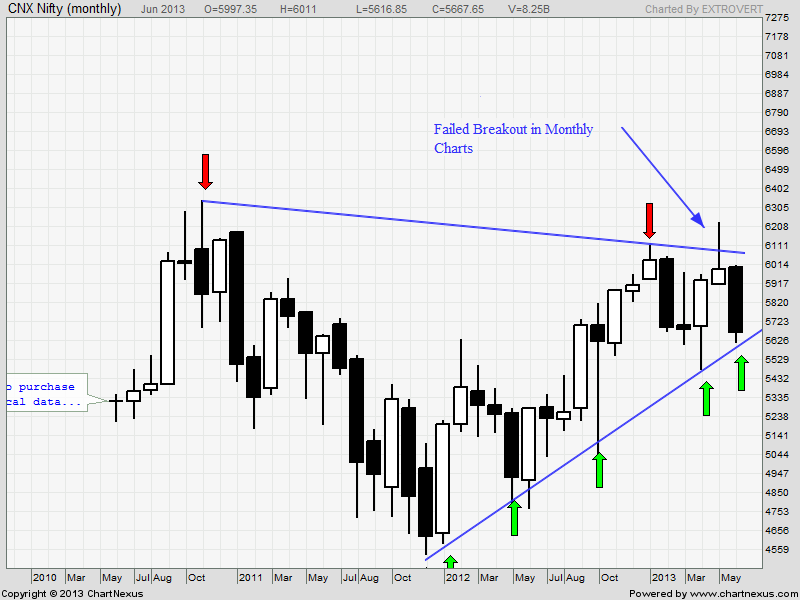
Monthly charts have given a failed breakout, Nifty has also formed a topping tails formation on the monthly charts. Topping tails are essentially bearish signals. This we have been discussing from the starting of June Month and power of topping tail formation on higher time frame is seen with Nifty correcting 5.3% 🙂
Nifty Trading Levels
Nifty Trend Deciding Level:5720
Nifty Resistance:5764,5808 and 5852
Nifty Support:5630,5588 and 5544
Levels mentioned are Nifty Spot
Let me go by Disclaimer these are my personal views and trade taken on these observation should be traded with strict Sl
Want to see post in your Inbox,Register by adding your email id in Post in your Inbox section
Follow on Facebook during Market Hours: https://www.facebook.com/pages/Brameshs-Tech/140117182685863
Sir what is so much importance of 5720