


Last week was roller coaster ride, Nifty closed at Life time Settlement high at 6131, But bad GDP data and Slide in Rupee spooked sentiment on street and Nifty closed with deep cut of 138 points, wiping of gains of 4 day in single session. OFS worth 15000 cores will be coming in Month of JUne, hence liquidity will be scare in stock market. Lets analyses technically whats surprise Market has for us in coming week.
Last week we gave Trend Deciding level as 6001 Nifty achieved 2 weekly targets on upside.
Nifty Hourly Chart

Nifty Hourly charts is forming a symmetrical triangle and closed below 200 HSMA, Break of 5970 will be blow out move by bears and nifty can see a fast fall till 5900 odd levels.
Nifty Gaps
For Nifty traders who follow gap trading there are 1 trade gaps in the range of 5400-6000 and all other gaps got filled.
- 5836-5853
- 5477-5446
Nifty Daily Chart
On Daily chart Nifty os entering demand zone of crossover of Blue and Green line as shown in below chart.Strong support lies in range of 5940-5900 as nifty has bounced several time from this range as shown in below chart. Shorts can do partial profit booking in this range.

Fibonacci technique

As per of Fibo Retracement theory Nifty took support at 5941 which is 38.2 % retracement from 5477-6231. Below 5941 next strong support comes at 5854
Fibonacci fan

Nifty Fibonacci fan are wonderful tool to find the top and bottom in short term.Last Week.Nifty was unable to sustain above Fibo Fans and gave the much expected pullback 🙂
Nifty Weekly Chart


Trading Monthly charts
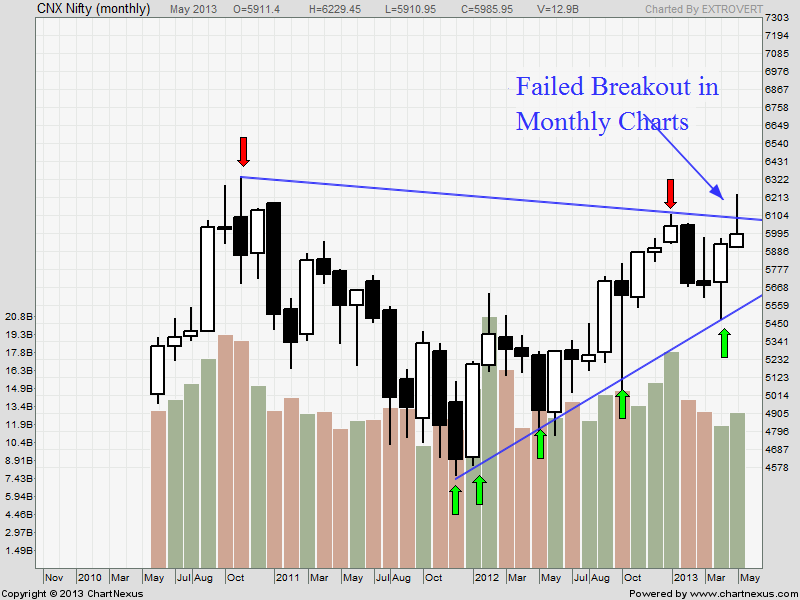
Monthly charts have given a failed breakout, Nifty has also formed a topping tails formation on the monthly charts. Topping tails are essentially bearish signals. Confirmation will come once Nifty closes and trades below 5937 on closing basis.
Nifty Trading Levels
Nifty Trend Deciding Level:6032
Nifty Resistance:6090,6133 and 6190
Nifty Support:5941,5892 and 5840
Levels mentioned are Nifty Spot
Let me go by Disclaimer these are my personal views and trade taken on these observation should be traded with strict Sl
Want to see post in your Inbox,Register by adding your email id in Post in your Inbox section
Follow on Facebook during Market Hours: https://www.facebook.com/pages/Brameshs-Tech/140117182685863