


As discussed last week USD INR is near an all important support of 53.84, Holding the same bounceback is expected. USD Crossed our Trend Deciding level 54.15 and achived our target of 54.98 . Lets analyze USD INR technical for coming week.
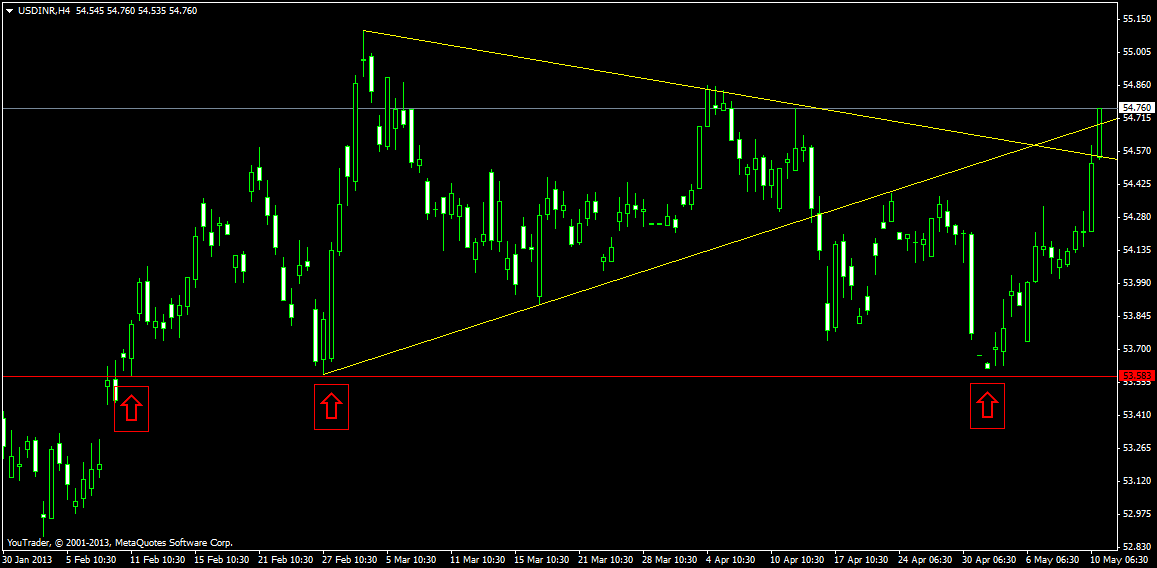
USD INR 4 Hour Chart

USD INR 4 hour chart has broken out in chart and is heading towards its swing high of 55.1 .
USD INR Daily Chart

As per Daily charts INR has closed above its 200 DMA which is bullish signal. Also it has closed above its symmetrical triangle which again shows a bullish picture. Follow up action needs to be seen.
USD INR Weekly Chart
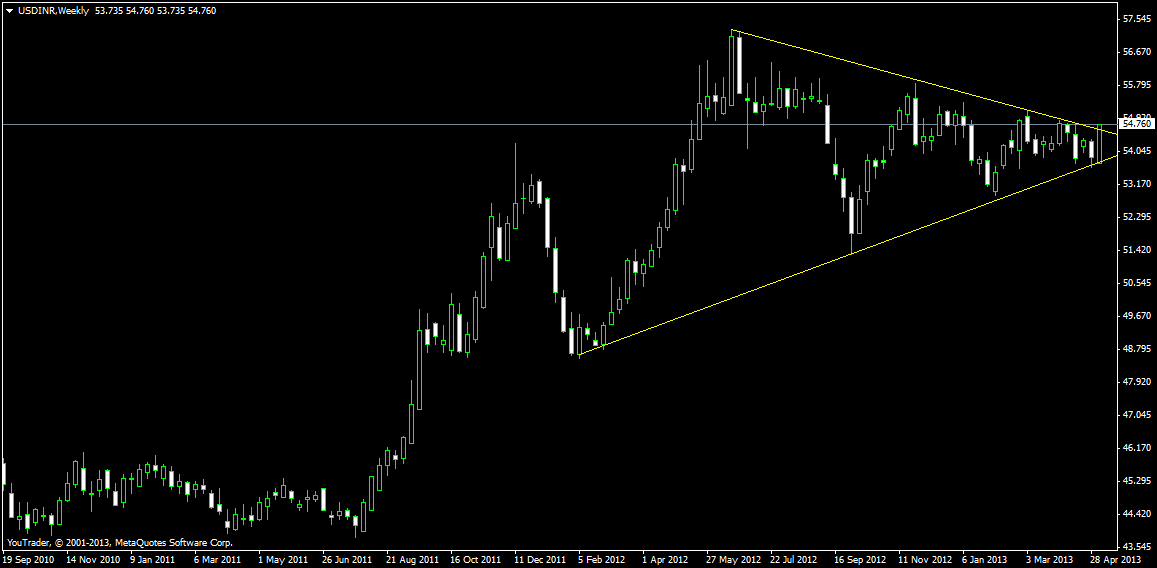
Weekly charts are trading in a perfect symmetrical triangle, which also has given breakout as it closed above 54.76 . Pennant formation leads to big breakout and traget of breakout comes near 60 odd levels in next 2-3 months time frame.
USD – INR Trend Deciding Level:55.00
USD – INR Resistance:55.3,55.70,56.40
USD – INR Support:54.60,54.20,53.50 and 53.00
Levels mentioned are USD – INR May Future
Follow on Facebook during Market Hours: http://www.facebook.com/pages/Brameshs-Tech/140117182685863