


Technical analysis is a science of forecasting the price of stock/index/commodities based on price and volumes data.
Technical analysis is practiced in two main categories
- Charts Patterns
- Technical Indicators
Chart Patterns — A chart pattern is a pattern that is formed within a chart when prices are graphed. In stock and commodity markets trading, chart pattern studies play a large role during technical analysis. When data is plotted there is usually a pattern which naturally occurs and repeats over a period of time.
Technical Indicators — Technical Indicator is a result of mathematical calculations based on indications of price and/or volume. The values obtained are used to forecast probable price moves and trend in a particular stock/index.Indicators help you assess the market for its momentum, direction, etc.
Technical Indicators are of two main types
- Leading Indicator
- Lagging Indicator
Leading Indicator— They give the trend reversal signals in advance based on mathematical calculations. RSI and Stochastic are two most important technical indicators. These works best in trading market or a period of sideways trading ranges.
Lagging Indicator – These follows price movements and has less predictive qualities. The most well-known lagging indicator is the MACD. These works best in trending market.
STOCHASTICS: An Introduction
The Stochastic indicator is a momentum indicator which gives you reversal signal in price momentum near important turning points allowing you enter the market with great accuracy for bigger profits.
Stochastic was developed by George C. Lane in the late 1950s, is a momentum indicator which gives you reversal signal in price momentum near important turning points allowing you enter the market with great accuracy for bigger profits.
According to an interview with Lane, the Stochastic Oscillator “doesn’t follow price, it doesn’t follow volume or anything like that. It follows the speed or the momentum of price. As a rule, the momentum changes direction before price.”
Calculation
The stochastic oscillator is calculated as a percentage of a security’s closing price to its price range over a given time period.
This indicator is calculated with the following formula:
%K = 100[(C – L14)/(H14 – L14)]
C = the last traded price at closing.
L14 = the lowest traded price in previous 14 trading sessions.
H14 = the highest traded price in last 14-day sessions.
%D = 3-period moving average of %K. It acts as a trigger line
The default setting for the Stochastic Oscillator is 14 periods, which can on Hourly,Daily,Weekly and monthly charts.
Let’s illustrate the calculation with Example of Dell Inc.
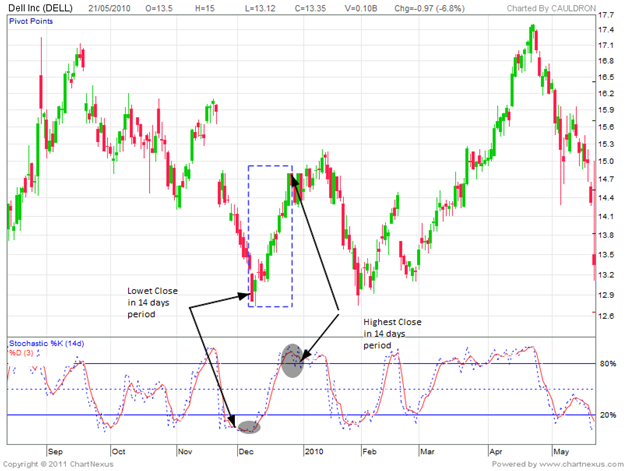
As shown in above Dell Inc. daily chart for a period of 14 trading days 08/12/2009 to 28/12/2009 as shown in Rectangle.
The High was 14.81$ and Low was 12.74$. Dell Inc. closed on 13.11$ after hitting a low of 12.74$ on 9/12/2009.
Let’s put the above data in formula:
%K = 100[(13.11 – 12.74)/(14.81 – 12.74)] =17.81 (Oversold range)
%K (Blue Line) in above chart is at 17.81 which is lower range in stochastic.
To calculate the Upper range of Stochastic we will the closing value on 28/12/2009 which is 14.6$
Putting the values in formulae we get :
%K = 100[(14.6 – 12.74)/(14.81 – 12.74)] =89.85 (Overbought range)
Low readings (below 20) indicate that price is near its low for the given time period. High readings (above 80) indicate that price is near its high for the given time period.
TYEPS OF STOCHASTICS: FAST, SLOW OR FULL
The Stochastic can be further categorized into 3 types
- Fast Stochastic Oscillator
- Slow Stochastic Oscillator
- Full Stochastic Oscillator
1. Fast Stochastic Oscillator
The Fast Stochastic Oscillator is based on original formulas for %K and %D. As per Lane %D divergence is the “only signal which will cause you to buy or sell”.
Fast Stochastic plots the location of the current price in relation to the range of a certain number of prior bars (dependent upon user-input, usually 14-periods).
The inputs to Stochastic Fast are as follows:
Fast %K: [(Close – Low) / (High – Low)] x 100
Fast % D: 3-period SMA of Fast %K
SLOW STOCHASTIC OSCILLATOR
The Slow Stochastic Oscillator smoothes %K with a 3-day SMA, which is exactly what %D is in the Fast Stochastic Oscillator.
Calculation for Slow Stochastic Oscillator:
Slow %K = Equal to Fast %D (i.e. 3-period moving average of Fast %K)
Slow %D = 3-period SMA of Slow %K
Notice that %K in the Slow Stochastic Oscillator equals %D in the Fast Stochastic Oscillator.
The Stochastic Slow is creates less false signal due to the smoothing effects of the moving averages.
FULL STOCHASTIC OSCILLATOR
The Full Stochastic Oscillator is a fully customizable version of the Slow Stochastic Oscillator. Users can set the look-back period, the number of periods to slow %K and the number of periods for the %D moving average.
Calculation for Full Stochastic Oscillator:
Full %K = Fast %K smoothed with X-period SMA Full
Full %D= X-period SMA of Full %K
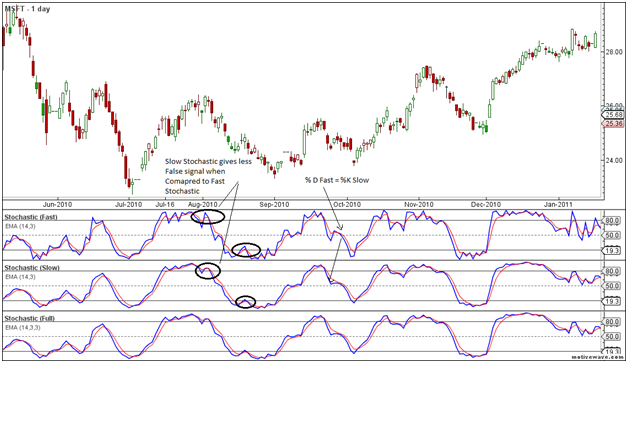
As shown in above chart of Microsoft technology with all 3 version of Stochastic Oscillator
- %K is Blue Line and %D is red line in above chart.
- Slow Stochastic gives less false signal when compared to fast stochastic as shown in above chart
- Circle are marked where Fast Stochastic is giving false signal but that gets smotted because of Moving averages in Slow Stochastic
- %D fast(Red Line) = %K Slow (Blue)
Next Week will discuss Trading using Stochastic
This week,please publish the AFLs for Stochastics.
Please publish the AFLs for fast,slow and full stochastics.
Sir,
I am a new And small Trader I read your Mail every time. Lot of time I have confuse, How And Where to take entry at Nifty Trading.How to calculate Nifty Levels.