


HUL

HUL came up with a good set of earning yesterday, Stock has broken out of its trading range with breal of pennant formation suggesting follow up buying will come in today.
Buy above 500 Tgt 510,518 and 527 SL 497
SBI

SBI has been trading perfectly in its uptrending channel, SBI has broken this channel yesterday and closed below 100 DMA suggesting pullback can be seen in this stock.
Buy above 2282 Tgt 2301,2330 and 1740 SL 2273
Sell below 2253 Tgt 2234,2220 and 2206 SL 2263
Maruti
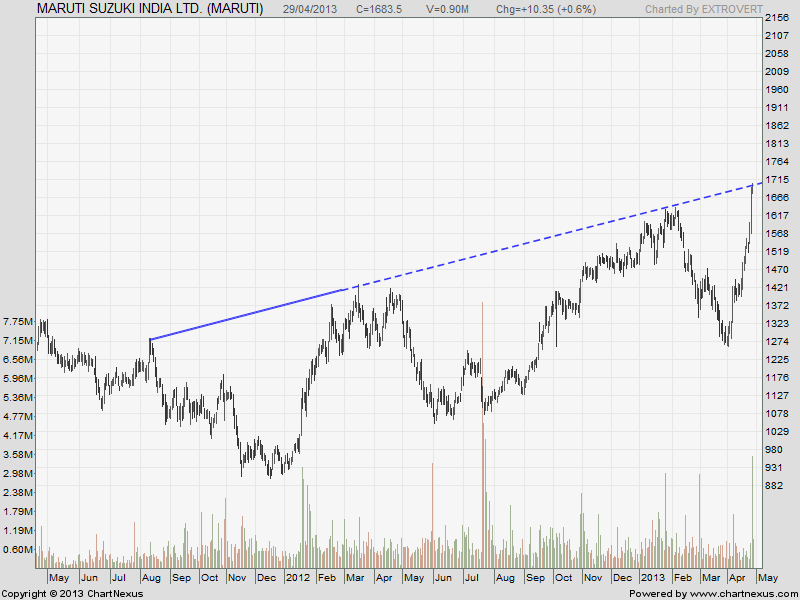
As disussed yesterday 1693 is breakout level for Maruti, Stock crossed above it but unable to sustain the highs and formed an hammer pattern which is a reversal pattern, todays price action will further confirm it. Unable to close above 1693 pullback is expected till 1600
Buy above 1688 Tgt 1700,1715 and 1728 SL 1683
Sell below 1671 Tgt 1660,1642 and 1631 SL 1675
- All prices relate to the NSE Spot
- Calls are based on the previous trading day’s price activity.
- The call is valid for the next trading session only unless otherwise mentioned.
- Stop-loss levels are given so that there is a level below/above, which the market will tell us that the call has gone wrong. Stop-loss is an essential risk control mechanism; it should always be there.
- Book, at least, part profits when the prices reach their targets; if you continue to hold on to positions then use trailing stops to lock in your profits.
We do discussion is Live market to update Nifty levels If you are interested you can LIKE the page to get Real Time Updates.
Follow on Facebook during Market Hours: http://www.facebook.com/pages/Brameshs-Tech/140117182685863
R these cash prices or future prices?
SPOT
Rgds,
Bramesh
Thanks a lot