


Infosys spoiled the Bullish sentiments on the Dalal Street, 2 days rally in nifty was snapped by Infy bad results and we are trading down sub 5500. Next week the Index Heavyweight Reliance will be coming out with results Tuesday post market hours and TCS on 17 April.
Last week we gave Trend Deciding level as 5525 achieved 1 weekly targets on downside and 1 weekly target on upside.
Nifty 4 Hourly Chart
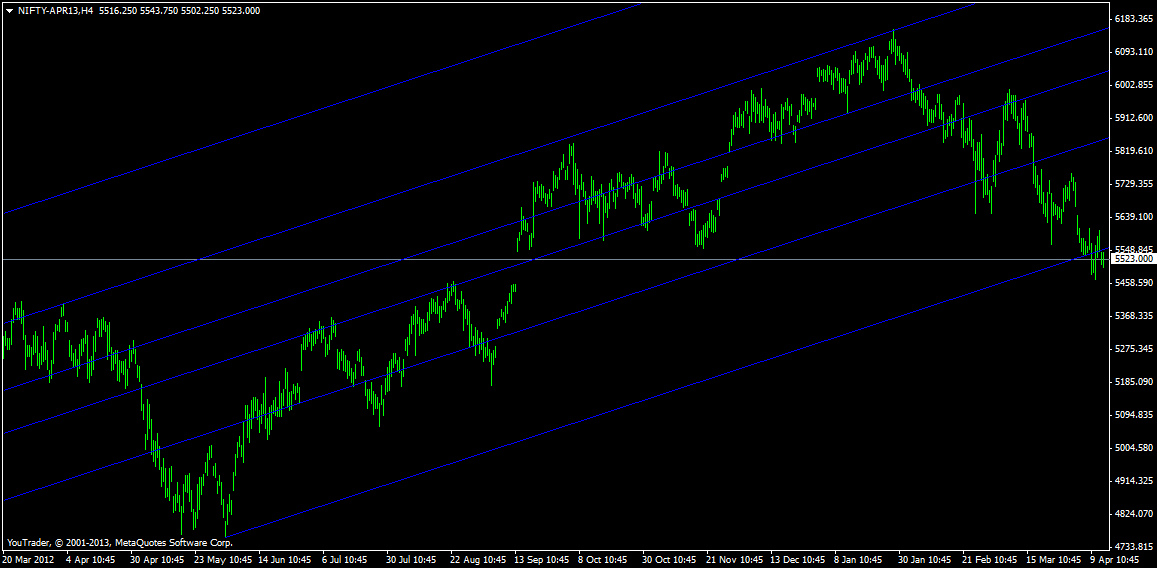
Nifty 4 Hourly charts has broken the Fibo Regression Channels below 5555 and will now act as resistance.5563 is the key level to watch.
Nifty Gaps
For Nifty traders who follow gap trading there are 1 trade gaps in the range of 5400-6000 and all other gaps got filled.
- 5872-5863
- 5477-5446
- 5672-5644 — Breakaway gap
- 5594-5544
Nifty Daily Chart
Nifty daily chart has made multiple bottoms in the range of 5477-5494, signifying demand is picking up in the range. Gap exists till 5446 and nifty has also taken support at its long term rising trendline. Trend is down but booking partial profits in shorts should be advisable,as crossover of Red and Blue trendline suggests the possible demand zone.

Fibonacci technique

Nifty daily chart as per Fibo Fans break the support of 5703 formed a break away gap and is stopped the fall near support of 5474 as discussed last week.Break of 5474 can spell danger for bulls as next support is near 5200 odd levels.
Fibo Retracement

As per of Fibo Retracement theory Nifty held and closed above strong support at 5511 which is 61.8% retracement. Holding the same bounce back till 200 dma can be seen
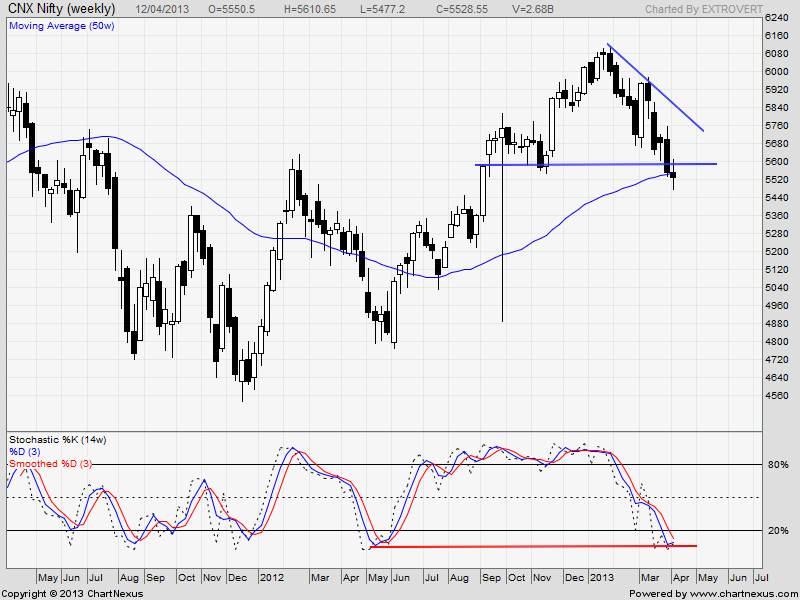
Nifty Weekly Chart

Trading Monthly charts
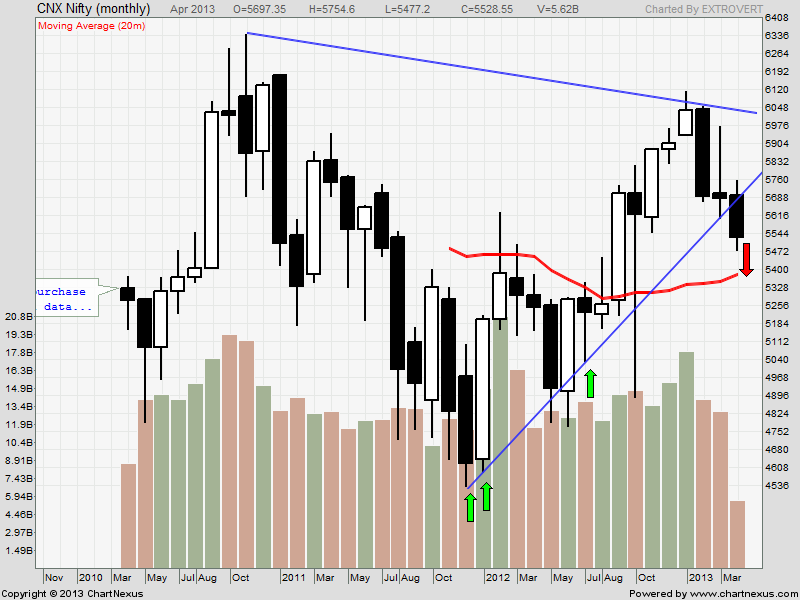
Monthly chart has been bearish from 6034 odd levels and 2 year old trend line is also broken. Next support comes at 5400 levels.
Nifty Trading Levels
Nifty Trend Deciding Level:5545
Nifty Resistance:5595,5644 and 5675
Nifty Support:5474,5435 and 5394
Levels mentioned are Nifty Spot
Let me go by Disclaimer these are my personal views and trade taken on these observation should be traded with strict Sl
We do discussion is Live market to update Nifty levels If you are interested you can LIKE the page to get Real Time Updates.
Follow on Facebook during Market Hours: https://www.facebook.com/pages/Brameshs-Tech/140117182685863
You said it right sir Infosys has spoiled the mini rally