


RBI policy is on 18 Dec and decision on rate cut will be out. bank Nifty is on a crucial juncture of make or break level of 12450. As discussed last week bank nifty was unable to close above the trendline resistance of 12540. Technically till 12540 is not crossed pullback till 12200 is very much on cards.
Bank Nifty Daily Chart

Bank Nifty crossed its long term trendline resistance of 12250 and closed above it on weekly basis, now 12250-12300 will become the support for Banknifty as seen in last week fall. Resistance now comes at 12540 and unable to cross the same pullback should be expected from that level.
Bank Nifty Fibo Fan Chart
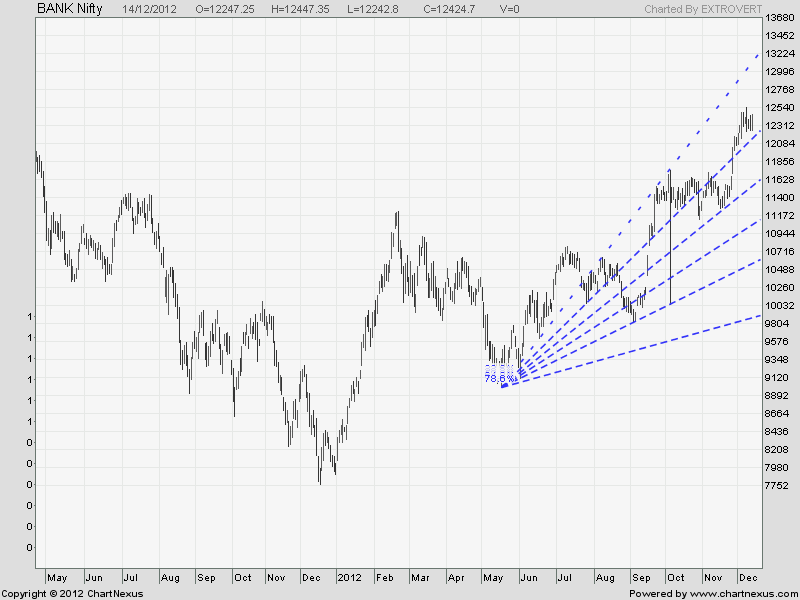
As per Fibonacci Fan theory 12300 should be strong support any break below it can see a quick correction in range of 12000-11800. Closing and sustaining above it can make Bank Nifty move 12600-12800 odd levels.
Bank Nifty Weekly Chart
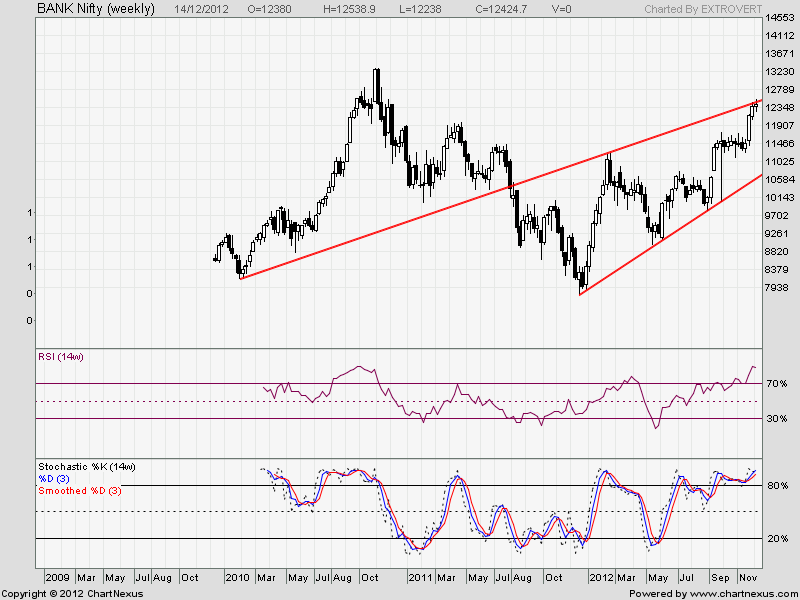
Weekly charts are quiet interesting as Indicators are reaching the top end of the levels and Bank Nifty hitting the weekly trendline resistance of 12540. Unable to cross the same will invite correction till 12000 odd levels. Breaking the same 12650-12800 on cards.
Bank Nifty Monthly Chart

Monthly charts are showing huge negative divergence with trendline resistance at 12540. Longs should be caution and keep sl of 12240 and higher time frame negative divergence will show effect sooner than later.
Bank Nifty trading levels for Week
Trend Deciding Level:12447
Resistance:12539,12630 and 12790
Support: 12250,12100,11940
All levels mentioned are Bank Nifty Spot