The Opening Week of New year 2012 was won by Bulls as Nifty closed up by 2% in a range bound and dramatic closing of week as market was open on Saturday also.
One interesting observation i found out on Facebook thought of sharing with readers
On 6 Feb 2010 Markets were open on Saturday and Nifty was trading ,High was 4768 and Low was 4712,4712 remained low for almost 2 years. So do we see the History repeating again ?
Another Interesting aspect for this week gone by was Food Inflation which dipped in negative but it failed to cheer markets nor Policy maker and surprised the common public.Normal Households food budget has doubled from past 1 year but as per Government data food inflation is negative. How is tht possible?
Food Inflation dropped is more because of High base effect we were having in past 1 year so its a mere statistical representation of year-on-year movement in prices of select items.
Fuel prices (especially LPG) that materially impact household consumption budgets, remain a contentious issue. Hence, it is too early to celebrate the decline in food inflation numbers. RBI cutting rates on this number will be a wishful thinking.
Coming Week will be quiet exciting in term of news flow data as Infy the IT bellwether will be declaring its results of 12 and IIP data will also be coming on 12 Jan.So expect a breakout either above 4800 or breakdown below 4690.
Lets jump into technicals
Nifty Hourly
 Past 4 days having been in a tight range. Nifty made almost 6 attempts to break 4780 level where BULLs were overpowered by BEARS, but BULLS did not let the break of 4676 level and start the gap filling process. So as such its a tight rope game which was played.
200 SMA on hourly chart is at 4778 which is the reason why so much selling pressure is coming at 4778 range.
Nifty Daily
 The above charts depecits the tight range Nifty has been trading on past 4 trading session after the rally on 3 Jan. Market did not do anything and preparing base for next move which should be fast and furious. 4800 above breakout and 4676 below breakdown
On Daily charts falling wedge pattern is forming which is a bullish pattern. Nifty has been closing above 20 SMA for 5 days now which makes the technical structure of market strong and a base formation by bulls. Above 20 SMA next target comes to 50 SMA@4910.
 Stoch and RSI will be approaching there overbought levels with Nifty coming near 4900 so time to book some profits on longs near 4881-4900 levels.
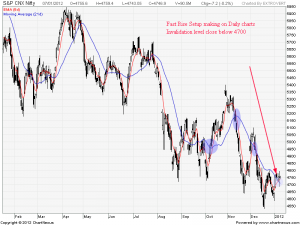
Fast Rise Set Up on Daily charts
 Fast rise setup is forming on daily charts, I have marked the previous fast fall and rise pattern in above chart. Its a good set up to know in advance the trending nature of Nifty.
Nifty Weekly
 On Weekly chart Nifty closed above 5 EMA@4748 after 4 weeks. Close above 5 EMA signify selling pressure has come down and accumulation on lower levels. To add with have a good positive divergence on indicators.Break above 4800 will lead to divergence to show effect.
20 WSMA@4940 which can be reached in next 1-2 week if and only if we have a weekly closing above 4800 in preceding week.
Nifty Monthly
 On Monthly chart the formation of lower lows had stopped, trendline resistance comes at 4880 on monthly charts.
4880-4900 should be good level to do profit booking for longs held by positional traders.
Last Week analysis Trend deciding level 4646 nifty made high 4794 levels.
Trend Deciding Level:4800
Nifty Resistance:4840,4881 and 4940
Nifty Support:4735.4676 and 4646
Follow on Facebook during Market Hours: http://www.facebook.com/pages/Brameshs-Tech/140117182685863


Dear Ramesh,
Thanks for the well dedicated next week’ Possibilities presentation.
In this article you have mentioned about the Interesting observation of 6th Feb, 2010 when low was made as 4712.75 and which remain low for almost next two years.
In this regard, please note that on 5 th feb,2010 Low was as 4692.35 and on 8th Feb, 2010 low formed was 4675.40 i.e. on the very next trading day of 6th Feb, 2010, low of 6th Feb,2010 was breached.
My data are based on Historical prices from NSE site.
If, I am wrong, please correct me.
Thanks and regards.
CM Gupta
Dear Sir,
I need to check with my data provider. Thanks for your update
Rgds,
Bramesh