


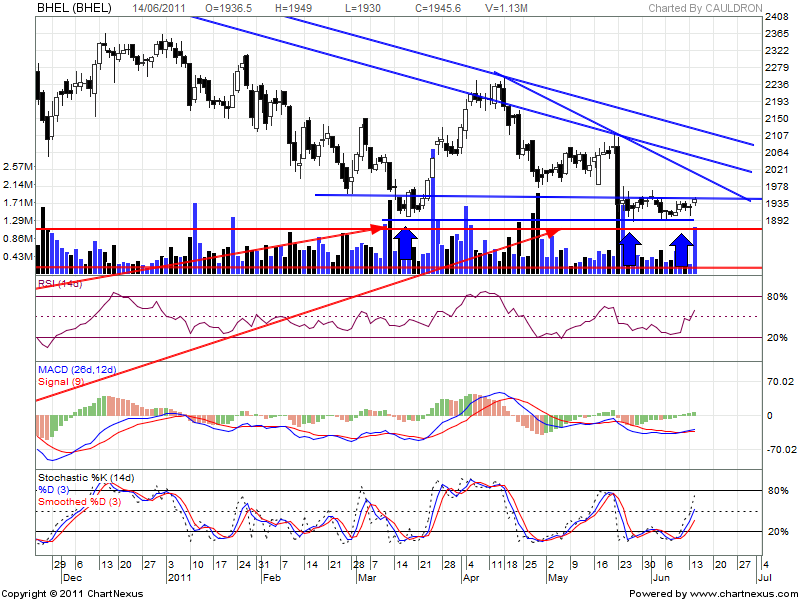

BHEL has been trading range of 1894-1950 in daily chart. Stock is now trading in upper end of range @1950 and with volumes above average.
RSI and Stochastic is generating BUY.
Buy above 1950 Tgt 1960,1973 and 1982
Sell below 1941 Tgt 1934,1922 and 1915
Kotak Bank

Kotak forming a symmetrical triangle with a Negative divergence in RSI.
Divergence should not be traded till we see the price confirming the downside move.
Buy above 452 Tgt 455,458 and 462
Buy above 1950 Tgt 1960,1973 and 1982
Sell below 1941 Tgt 1934,1922 and 1915

Divergence should not be traded till we see the price confirming the downside move.
i m very much interested in learning technicals from you kindly let us knot if it is possible. if no then let us know the institute or way so that i can learn it please mail me to mack19841984 at the rate rediffmail.com